3
$\begingroup$

I use cpgram function in R to produce a cumulative periodogram of a monthly time series. Its horizental axis is a number between 0 and 6 labeled as frequency: what does these numbers mean, since the frequency in cumulative periodogram should be between 0 and 0.5 like the ones shown below (upper ones)?
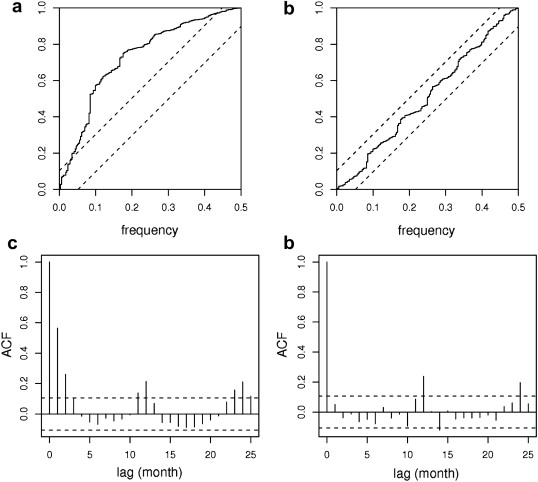
enter image description here

Also, do you know how can I create cumulative periodograms like these plots?

$\endgroup$

1 Answer 1

1
$\begingroup$

The x-axis is labeled in "number of cycles per unit of time". It is a bit akward at first. For instance, assume you have a monthly time series starting February, 2000. You might define it as:

  series <- ts(datavalues, start=c(2000,2), frequency=12)

This means that the time unit is 1 year and there are 12 data points per time unit. Then, functions like spectrum and cpgram label the x axis in frequencies giving their number of cycles per year. So 6 is the Nyquist frequency, 6 periods per year or a two month long cycle, the highest frequency observable with monthly data (higher frequencies are aliased).

HTH.

$\endgroup$

Your Answer

By clicking “Post Your Answer”, you agree to our terms of service and acknowledge you have read our privacy policy.

Not the answer you're looking for? Browse other questions tagged or ask your own question.