2
$\begingroup$

The Data:

I have the results of an experiment where participants were given 30 stimuli and asked to sort them into two groups. The participants were asked to sort them into the two groups without any information about what the groups should be or how they should be sorted.

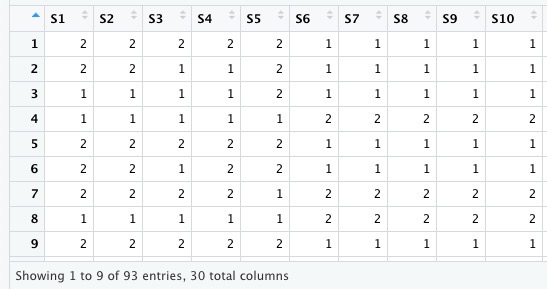
There is data (see 1) from 93 participants. Each column represents one stimulus {S1, S2,...} and the cells hold a binary value {1, 2} that represents the group it has been put into.

So for example: Participant 1 put {S1, S2, S3, S4, S5} into group 1, whereas participant 2 put {S1, S2, S5} into group 2 and {S3, S4} into group 1.

screenshot data

The Goal:

I want to find out whether some stimuli were grouped together more often than others, i.e. whether participants found similar groups.

The Problem:

The groups {1, 2} are interchangeable.

So, for example, participant A put S1, S2 and S3 into group 1, while participant B put these three into group 2. They both would have grouped the stimuli together and I would want to see that these stimuli have been grouped together more often, even though into different groups.

It does not matter whether they were assigned group 1 or group 2. It is ony important which stimuli are in the same group.

How could I get these relations out of my data?

Similar Problem:

The problem mentioned here is very similar to this one. However, the group labels don't change between participants (i.e. 1 is always "disease present" and 0 is always "disease not present"). Something like the suggested hierarchical clustering looks very promising, but I am not sure how I could make it account for the changing group labels.

$\endgroup$
2
  • $\begingroup$ By binary data we usually mean data coded 1,0, often with the "asymmetric" meaning 1=present, 0=absent. In your case, you have just 2 "symmetric" classes: this vs that. Your variables are dichotomous nominal. $\endgroup$
    – ttnphns
    Commented May 27, 2021 at 19:30
  • $\begingroup$ Thanks for the info! Probably that is the reason why I did not find anything useful on the internet for my problem. $\endgroup$
    – Julian
    Commented May 29, 2021 at 14:33

1 Answer 1

2
$\begingroup$

Your task is the comparison of partitions without knowing any labels for the groups. This task is also called "assessment of agreement between clusterings" (contrasted to "assessment of agreement between classifications" - where we know the class labels).

You have not done any clustering yet, but admit that your participants were that clustering machines who gave you, each, a vector of 2-cluster solutions. Each solution is a row (a participant) in your data.

Actually, the number of clusters might have been more than two and even different for different participants.

Cluster solutions, the participants, are similar if they partitioned the set of stimuli similarly. For example, two solutions A and B are similar if there are many stimuli out of the 30 which tend to encounter in one some cluster in A solution and one some cluster in B solution; while stimuli found in different clusters in A tend to dissociate in B too. You should compute a measure of clustering agreement (also known as external clustering criterion) between each two solutions (participants).

Upon obtaining such square symmetric 93x93 similarity matrix, you can perform cluster analysis on it, to cluster the participants. A hierarchical cluster analysis would be the most appropriate here. It will cluster your participants into groups of similar ones: who has partitioned the stimuli similarly. Then you will turn back to the data to reveal the patterns characteristic for each such group.

Clustering agreement measures are multiple. To list some: Dice (F1), Ochiai (Folkes–Mallows), Adjusted Rand (Cohen's kappa), Phi correlation (Hubert's Gamma). These are called "pairs" aka "comembership confusion matrix" measures. Another line of measures to use include Overlap, F Clustering Accuracy, Mutual Information, and Homogeneity&Completeness V. On my page, download collection "Compare partitions" to read about these and related measures. If you are an SPSS user, you can use the macro !CLUAGREE I wrote to compute the square matrix of any such measure, which you will then submit to a cluster analysis. (You will have first to transpose your data, to make the participants - the "cluster solutions" - the columns rather than the rows.)

$\endgroup$
1
  • $\begingroup$ Thank you for the detailed answer! I will give that a try and see what I get. One other idea I came up with was just finding all groups (groups of 2, then groups of 3, 4, 5 and so on) that were found by any participant and count how often the same group was found by the other participants. This, however, has a few drawbacks. So your solution seems definitely like the more appropriate in this case. $\endgroup$
    – Julian
    Commented May 29, 2021 at 15:26

Your Answer

By clicking “Post Your Answer”, you agree to our terms of service and acknowledge you have read our privacy policy.

Not the answer you're looking for? Browse other questions tagged or ask your own question.