2
$\begingroup$

I have two equations for TPR and FPR (based on the threshold t), for example:

TPR = (1-t)^2
FPR = (1-t)^0.2

How can I calculate AUC based on this? I'm not familiar with this, and the resources online are mostly theories, can someone help, please? Thanks.

$\endgroup$

2 Answers 2

3
$\begingroup$

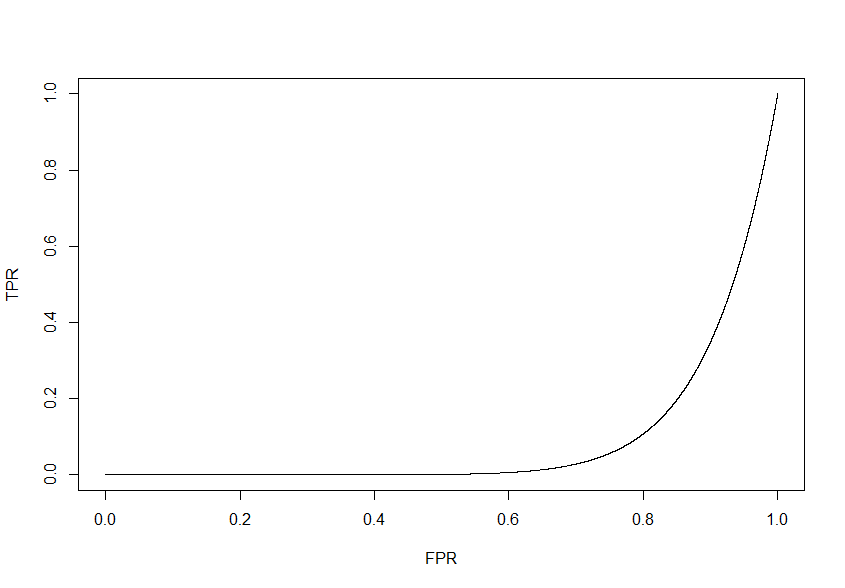
There's nothing more practical than a good theory! You need to graph TPR against FPR (for example, for $t=0.1$, $TPR=0.81$ and $FPR=0.98$, this gives you one point of the graph). The image below takes 1,000 points resulting from giving 1,000 different values to $t$

enter image description here

Then you can calculate the area under the curve as an integral. Since we're not likely to have an expression for the curve we've plotted, we should try to approximate it. You can get a reasonable approximation of the AUC by calculating the average height of this graph and then multiplying it by its width ($1$ in this case).

However, in this specific example, we can get the exact value by integrating directly, since it's possible to get TPR as a functión of FPR: $TPR = FPR^{10}$, therefore $AUC = \int_{0}^{1} t^{10}dt = \frac{1}{11}$

$\endgroup$
2
  • $\begingroup$ Hi I've got the plot, but I don't know how to estimate AUC? Is there a formula or something? Or an example? Thanks in advance. $\endgroup$
    – wawawa
    Commented Jun 12, 2021 at 14:40
  • 1
    $\begingroup$ You can get a quick estimation by calculating the average height of the plot. Calculate FPR for $TPR=0$, $TPR=0.01$, $TPR=0.02$ and so on until $TPR=1$. Its average is a good estimate of the area under the curve. For something more precise, take a look at some numeric integration methods. I've editted the answer to deal with this part too. I hope it helps. $\endgroup$
    – David
    Commented Jun 12, 2021 at 14:55
0
$\begingroup$

What you are asked to calculate is the area under the curve (AUC). Specifically, for the receiver operating characteristic curve or ROC curve., and would explain why TPR and FPR have a meaning (unsure how though.)

Conceptually it's the sensitivity "plotted against and integrated with respect to" $1-specificity$ for each threshold.

I think the closer the area is to one, the better.


For completeness to the previous answer, the integral is:

$$\int \mathrm{TPR} \,\,\, d(\mathrm{FPR}) = ? $$

If you replace $u=1-t$ then:

$$TPR=u^2$$ $$FPR=u^{0.2}$$

and also: $$u=FPR^5$$ $$TPR=FPR^{10}$$

and integrate now $$\int TPR \,\, dFPR = FPR^{10} d(FPR) = \frac{FPR^{11}}{11} + C$$

there are other ways to get that result as well.

$\endgroup$

Your Answer

By clicking “Post Your Answer”, you agree to our terms of service and acknowledge you have read our privacy policy.

Not the answer you're looking for? Browse other questions tagged or ask your own question.