9
$\begingroup$

I am new in statistics so sorry about my elementary question. I have a data set and simple linear regression equation calculated from this data:

f(x) = ax + b

I would like to know if I can (and if so how) use slope (a) from this linear regression to determine strength of data set trend? I need to know is trend is growing or falling and how strong (steep) is.

I am not sure how to calculate it because there is not max value of tangent value so I'm not able how to find out if it's a strong or weak trend. I hope I described my problem correctly.

Edit: I am working on my school project and I would like to accomplish this: there is a dataset, in my situation these datasets contain a business data (monthly sales, number of orders, an average order size etc.). I would like to have a simple indicator for each of these quantatities that is able to visually describe a trend (a strength) of this dataset in this manner:

  • Growth (green color) - if growth is strong, e.g. between 10 - 100% of maximum growth
  • Low Growth (yellow color) - if growth is weak, e.g. between 0-9% of maximum growth
  • No move (gray color) - no move (when regression has no slope or very small)
  • Low drop (yellow color) - drop is between 0-9% of maximum drop
  • Drop (red color) - drop is strong, 10-100% of maximum drop

P.S. In my app I have another visual indicator but it describes a dataset in different way - in particular time, how it works - I compute a median value of whole dataset and in a particular point I compare a value in my dataset with median value and determine a color that describes a status in this particular value. Some simple solution I need for the whole dataset.

Additional info: to describe what I am trying to solve I created these two plots that plot subset of my dataset. In header there is a slope value of this data subset. Both slopes are negative, so trend in this data is decreasing. This information I can determine myself but both trends are not equal. The first trend is stronger than the second (slope value is higher too). I need to know if is there some scale or dimension according to I can normalize slope value and say in my application, e.g. dataset that describes this slope value is not so much important, because slope is in max 5% of its maximum value but this slope is in 75% of its maximum negative value, so be careful and take care of this trend!

All what I need to know is:

what is minimum and maximum value of a slope parameter in linear regression equation?.

If I know the scale of the slope value I can compute everything I am asking. I can preprocess data and normalize them or do whatever else what is needed.
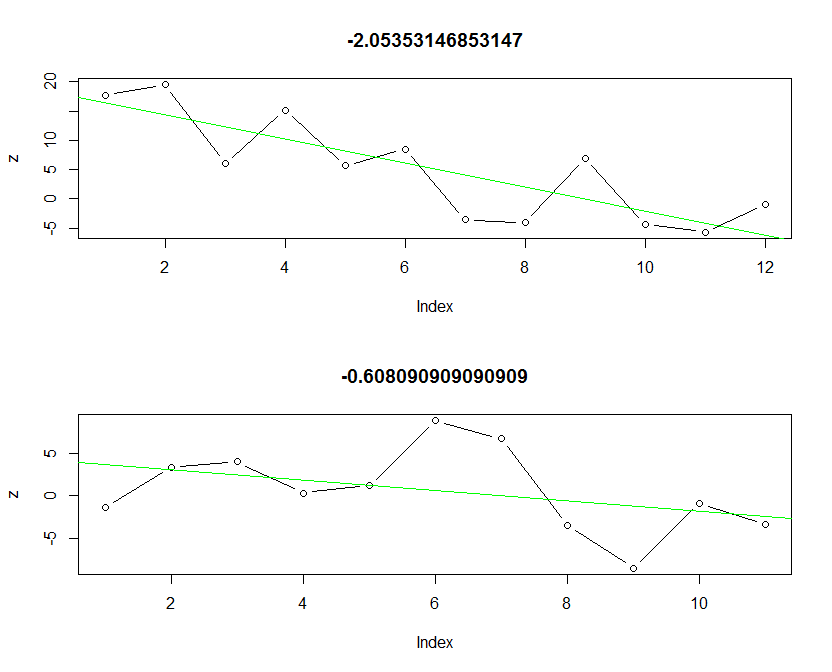
enter image description here

$\endgroup$
8
  • 1
    $\begingroup$ You'd need to define what you mean by 'trend strength'. There are many possible interpretations. $\endgroup$
    – Glen_b
    Commented Mar 24, 2013 at 22:21
  • 1
    $\begingroup$ (+1) The edited question is exemplary in how well it explains what is needed and provides a context for answers. $\endgroup$
    – whuber
    Commented Mar 25, 2013 at 13:45
  • $\begingroup$ @whuber - thanks, I hope somebody will answer my question, I am sure this is not so complicated issue for local statisticians. $\endgroup$
    – jnemecz
    Commented Mar 25, 2013 at 13:56
  • 1
    $\begingroup$ What's the matter with Peter Flom's answer? Your comments to it do not seem to acknowledge what he has told you, but instead ask about things that--even after your edits--appear to me to be irrelevant or extraneous to the question. $\endgroup$
    – whuber
    Commented Mar 25, 2013 at 14:01
  • 1
    $\begingroup$ I am referring to the first part of his answer. I believe the reference to $R^2$ is there only because he was trying to get clarification of your original question: with your edits, it is evident that $R^2$ is not relevant (and may even give results you find to be erroneous.) You are asking about the size and amount of trend and that is measured by the slope term: it's that simple. $\endgroup$
    – whuber
    Commented Mar 25, 2013 at 14:18

3 Answers 3

15
$\begingroup$

A couple notes: Usually people write the equation as either $y = b_0 + b_1X$ or $y = a + bx$ Your version is OK, but might be confusing when you see other versions.

In your equation, $a$ is a measure of how much $f(x)$ is expected to rise for a 1 unit increase in $x$. If $a$ is positive, then $f(x)$ is expected to rise as $x$ rises; if $a$ is negative, then just the reverse. So, $a$ is a measure of the slope. But $a$ is unit-dependent: If you change from measuring $x$ in millimeters to meters, $a$ will change, but its meaning will not.

There are a few measures of the strength of the relationship. The most common is $R^2$, this is a measure of the proportion of variance in $f(x)$ that is explained by the linear relationship with $x$.

EDIT with regard to new question

A trend occur in units per time; there are several ways to standardize th units. You could, perhaps most simply, use percentage change from the beginning point. This is what is often done, e.g., with trend in stock market averages to accommodate their different initial values.

$\endgroup$
1
  • 1
    $\begingroup$ One thing one could add is to advise against the danger of spurious regressions. Since this is a school project it will probably not matter, but you need to be careful about your specification. After all if you estimate $$y = a + bx$$, you will always find a solution, but it may not be significant even with decent $R^2$. $\endgroup$
    – BlueTrin
    Commented Mar 27, 2013 at 10:33
7
$\begingroup$

R^2 is a scaled measure of the error in the fit. Here is some more information on it. http://mathworld.wolfram.com/CorrelationCoefficient.html

Although R^2 is useful, there is no perfect measure. They each have strengths and weaknesses. I find that I use measures like the Akaike Information Criterion much more because I have a number of candidate analytic functions that fit with somewhat consistent R^2 and I need to find a mixture of them, with weights, that more likely indicates the underlying nature of the system.

Relevant Links Include: http://www.csse.monash.edu.au/~dschmidt/ModelSectionTutorial1_SchmidtMakalic_2008.pdf

The slope can go from -infinitity to +infinity, though in practice it is limited by the economics of the business. If you are selling butter, and you have a finite production capacity then the largest number of sales you can have is constrained by that capacity, or by the sum of the historic under-sold capacity plus storage. A business can't lose infinite money, only its entire net worth, plus all the debt its credit rating can rack up. Your negative slope will be constrained by business realities of that sort - but they will be particular to your business. In theory it could be anything between plus and minus infinity. In practice, if you pick the right sorts of values - the right sorts of domain and range then your slopes will be in a useful range.

You might consider two different EWMA (Exponentially Weighted Moving Average) functions, one with a different period than the other. When the short period is above the long, there is some sort of increase (positive), and when the long is on top then there is decrease. It is a very simplistic indicator, but it can be responsive to the data. A single linear fit doesn't respond quickly to changing business realities, especially if it is operating over a large span of time or sample values.

$\endgroup$
1
  • $\begingroup$ It looks like you may have mixed up the meanings of goodness of fit and effect size. None of these criteria address "how ... steep" the slope is, as requested in the question. $\endgroup$
    – whuber
    Commented Mar 25, 2013 at 13:44
3
$\begingroup$

One way to make comparisons on the relative "strength" of 2 independent variables in the same linear model is to divide them by their respective standard deviations (i.e. use z-scores). It's still not an apples to apples comparison, but it can be useful to see if, for example, a 1 SD increase in X results in a greater increase in Y than 1 SD of C does - particularly if the SD is a useful descriptor of both IVs (e.g. they are normally distributed).

$\endgroup$

Your Answer

By clicking “Post Your Answer”, you agree to our terms of service and acknowledge you have read our privacy policy.

Not the answer you're looking for? Browse other questions tagged or ask your own question.