3
$\begingroup$

Introduction

Service is allocated to an infinite source of customers i.e. there is always a service in progress. The duration of the $i^{th}$ service is generally distributed $\Delta_i \sim F_{\Delta}$ where $F_{\Delta}:\mathbb{R}_{\geq0} \to \mathbb{R}[0,1]$ is a uni-variate cumulative distribution function (cdf). This successive service process is illustrated below. An event occurrence (old customer out, new customer in) evolves as follows. $$ t_{k+1} = t_k + \Delta_k $$

Interrupted service process

The process operates long enough to be in a steady-state or to have reached a stationary distribution. The process is then interrupted at time $T$ for inspection. Upon inspection, the interrupted service has an age $\tau_k = T-t_{k}$ and remaining lifetime $r_k = t_{k+1}-T = t_k + \Delta_k - T$.

I am interested in obtaining distributions for both $\tau_k$ and $r_k$. I have done so algebraically and via simulation. I will provide both the simulation in Python as well as the expressions.

I believe my expressions are correct but something if wrong with my simulations as some bias is introduced. It bothers me as the simulation is very simple but I'm obviously missing something. Please follow along and help me identify the source of error.

Algebraic expressions

Let $F_u$ be a uniform cdf defined over the interval $[0,F_{\Delta}^{-1}(\alpha)]$ where $\alpha$ is almost 1 but slightly less. This is done because $F_{\Delta}$ may have a domain unbounded to the right. Let $f_u$ be its probability density function (pdf) while $f_{\Delta}$ is the service pdf of $F_{\Delta}$. We have a pdf for age of the interrupted process $$ f_{\tau}(\tau) = \frac{1}{\eta}f_{u}(\tau)\left( 1-F_{\Delta}(\tau) \right) $$ where $\eta$ is a normalising constant. For the remaining age $r$ we use convolution because $r = \Delta - \tau$ $$ \begin{align} f_{r}(r) & = \frac{1}{\eta}\left(f_{\Delta}*f_{\tau} \right)(r)\\ & = \frac{1}{\eta}\int_{0}^\infty f_{\Delta}(r+\tau)\, f_{\tau}(\tau)\,d\tau \end{align} $$

Simulation

In the simulation, I allowed $t_k$ to evolve until $t_{k+1} \geq T$. I then terminated and recorded $\tau = T - t_k$ and $t_{k+1} - T$. This is then repeated several times in order to plot normalised histograms as simulated pdfs.

import numpy as np
import matplotlib.pyplot as plt
from scipy.stats import norm,uniform,gamma
from scipy.integrate import quad


def get_interrupted_service(service,T):
    '''Helper function: single run simulation'''
    t = 0
    while True:
        delta = service.rvs()
        # if t + delta > T:
        if t + delta >= T:
            break
        t += delta
    age = T - t
    remain = delta - age
    # remain = t + delta - T
    return age,remain,delta


def sample_interrupted_services(service,T,n_samples):
    '''Main function: collects statistics from independent runs'''
    ages = np.zeros(n_samples)
    remains = np.zeros(n_samples)
    deltas = np.zeros(n_samples)
    for i in range(n_samples):
        if i %10 == 0:
            print('{0} of {1}'.format(i+1,n_samples))
        ages[i],remains[i],deltas[i] = get_interrupted_service(service,T)
    return ages,remains,deltas

I also add the numerical computations of the algebraic expressions.

def get_age_density(service,alpha=0.99):
    uni = uniform(loc=0,scale=service.ppf(alpha))
    def f(t,norm):  
        return uni.pdf(t)*service.sf(t)/norm
    norm = quad(func=lambda t: f(t,1),
                a=0,b=service.ppf(alpha))[0]
    return lambda t: f(t,norm)


def get_remainder_density(service,alpha=0.99):
    age_pdf = get_age_density(service,alpha)
    def convolution(r,norm):
        return (quad(lambda age: service.pdf(r+age)*age_pdf(age),
                     a=0,b=np.inf)[0])/norm
    norm = quad(lambda r:convolution(r,1),
                a=0,b=np.inf)[0]
    return lambda r: convolution(r,norm)

Results

The code is run as follows.

if __name__ == '__main__':
    # Setup simulation
    alpha = 0.9999  # almost 1 e.g. 1 - 1e-6
    f_delta = gamma(a=7,scale=2)
    T = 10000   # Run long enough to reach steady state (bit extreme maybe?)
    samples = 5000  # Need a reasonable amount of iid samples
    # Perform simulation
    tau,r,delta = sample_interrupted_services(f_delta,T,samples)
    # Plot empirical pdfs
    fig,ax = plt.subplots(3,1)
    ax[0].hist(tau,bins=80,density=True,alpha=0.5,label='simulated ages')
    ax[1].hist(r,bins=80,density=True,alpha=0.5,label='simulated remainder')
    ax[2].hist(delta,bins=80,density=True,alpha=0.5,label='simulated service durations')
    # Plot algebraic counterparts for comparison
    t = np.linspace(0,f_delta.ppf(alpha),100)
    age_pdf = get_age_density(f_delta,alpha)
    ax[0].plot(t,age_pdf(t),label='ages')
    r_pdf = get_remainder_density(f_delta,alpha)
    ax[1].plot(t,[r_pdf(ti) for ti in t],label='remainder')  # SLOW !!!
    ax[2].plot(t,f_delta.pdf(t),label='service durations')
    # Show legend/labels
    _ = [ax[i].legend(loc='upper right') for i in range(3)]
    fig.show()
    # Assess bias
    actual_mean = f_delta.mean()
    empirical_mean = delta.mean()
    bias = empirical_mean - actual_mean
    print('actual mean: 'actual_mean)
    print('empirical mean: ',empirical_mean)
    print('bias: ',bias) # should be close to zero.

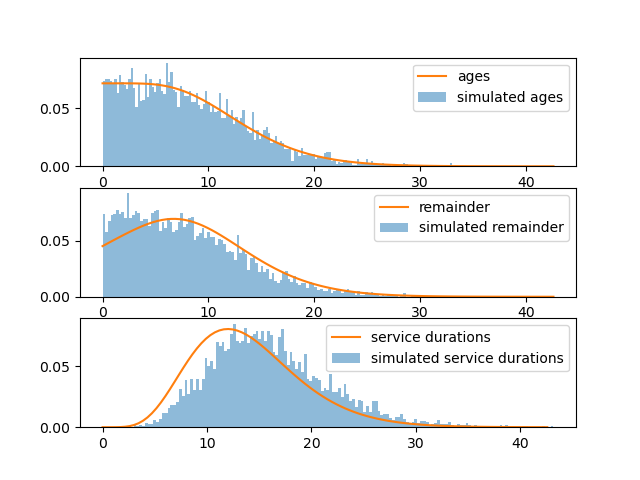
This produces the following. The concern now becomes clear once one looks at the bottom plot. Why is the simulated service duration pdf so biased to the right?. If I look at the middle plot, the misfit is probably due to this bias. I must have not done the simulation properly. Please help me identify the errors.

enter image description here

P.S. I do not actually know if I have asked this question in the correct Stack Exchange website. It was between Cross Validated and Operations Research. I chose the former.

Edit

I have made a duplicate on Operations Research which references this question. Hopefully this way I can identify which site the questions suits better.

$\endgroup$

1 Answer 1

1
$\begingroup$

This question has been answered here. I repeat the answer by @Mark L. Stone

"You have fallen victim to the renewal paradox, a.k.a. inspection paradox, a.k.a. length-biased sampling.

$F_{\Delta}$ is the distribution of service time for the kth customer, but it is NOT the distribution of service time for the customer being served at a preselected time $T$. The very manner of selecting the customer based on observing at a preselected time biases the distribution of service time for that customer. It is not the same as observing the kth customer. Fixing the time and looking at the then current customer is different than fixing the customer and looking at its time.

To make it simple to think about, consider a service time distribution which takes value 1 or 2 minutes, each with probability 1/2. If the system is allowed to run for a long time, about 2/3 of the time the system is running, the customer then being served has total service time of 2, and 1/3 of the time has a total service of 1. So if we preselect a tine $T$ (in steady state), the average total service time for the customer being served at that time = 5/3, not 3/2.

If the service time distribution $F_{\Delta}$ is exponential, then in steady state, the total service time of the customer being served at a preselected time is exponential with mean double that of $F_{\Delta}$, which is the distribution for the kth customer. If you now consider that the exponential distribution is memoryless, if we randomly pick a time at which to observe the remaining (not total) service time of the customer then being served, it should have distribution $F_{\Delta}$, i.e., the total service time of the kth customer. But on average, the preselected time will be halfway through the service time for the customer being served. So how can that be? Because the customer then being served has average total service time equal to double that of the kth customer, and so 1/2 the doubled average is equal to the average for the kth customer, thereby resolving that paradox. "


I also provided some additional insight from what I have learned after being steered into the right direction.

What has been learned comes from chapter 14.4 of Probability, Markov Chains, Queues, and Simulation and chapter 23 of Performance Modeling and Design of Computer Systems.


Service time distribution of customer observed at time $T$

Let us denote the service time distribution of a customer observed at time $T$ by the random variable $\phi\sim F_{\phi}$ where $F_{\phi}$ is its cdf and $f_{\phi}$ is its pdf. Interest lies in $f_{\phi}$ due to its use in computing expected values. It will also be used to derive $f_r$ and $f_{\tau}$.

As noted by Mark and the simulation experiments, $f_{\phi} \neq f_{\Delta}$. We can argue the following about $f_{\phi}$ by reasoning in terms of $P(t \leq \phi \leq t + dt) = f_{\phi}(t) dt$ $$ \begin{align} f_{\phi}(t)dt & \propto \mbox{length of observed service interval}\\ & \propto t \end{align} $$ and $$ \begin{align} f_{\phi}(t)dt & \propto \mbox{frequency of service intervals with length } \phi\\ & \propto f_{\Delta}(t) dt. \end{align} $$ Hence we have $$ \begin{align} f_{\phi}(t)dt & \propto t f_\Delta(t) dt\\ & = \eta\, t f_\Delta(t) dt \end{align} $$ where the constant of normalisation has closed form $$ \begin{align} \eta & = \left( \int_{0}^{\infty} \Delta f_{\Delta}(\Delta) d\Delta \right)^{-1}\\ & = \frac{1}{\mathbb{E}[\Delta]} \end{align} $$ which yields $$ f_{\phi}(t)dt = \frac{t f_\Delta(t) dt}{\mathbb{E}[\Delta]} $$ such that we obtain the desired result $$ f_{\phi}(t) = \frac{t f_\Delta(t)}{\mathbb{E}[\Delta]} $$

Process age $f_{\tau}$

If we have observed/inspected service duration $\phi$ then the service age $\tau$ at observation $T$ should be uniformly distributed as $\tau \in [0,\phi]$. We now reason that $P(\tau \leq t \mid \phi) = t/\phi = F_{\tau}(t\mid \phi)$. Take the derivative with respect to $t$ $$ \begin{align} \frac{dF_{\tau}(t|\phi)}{dt} & = \frac{1}{\phi}\\ \therefore dF_{\tau}(t|\phi) &= \frac{dt}{\phi} \\ & = P(t \leq \tau \leq t + dt| t \leq \phi) \\ & = f_\tau(t|\phi) dt \end{align} $$ We are not interested in the conditional. Hence $\phi$ needs to be marginalised out. $$ \begin{align} P(t \leq \tau \leq t + dt) & = f_\tau(t) dt\\ & = \int_{0}^{\infty} f_\tau(t|\phi)\,dt \, f_{\phi}(\phi) \mathbb{1}_{\{t\leq \phi\}} \,d\phi\\ & = \int_{t}^{\infty} \frac{dt}{\phi} f_{\phi}(\phi) d\phi\\ & = \int_{t}^{\infty} \frac{dt}{\phi} \frac{\phi f_{\Delta}(\phi)}{\mathbb{E}[\Delta]} d\phi \\ & = \frac{1}{\mathbb{E}[\Delta]}\left( 1 - \int_{0}^{t} f_{\Delta}(\phi)\,d\phi\,dt \right) \\ & = \frac{1 - F_{\Delta}(t)}{\mathbb{E}[\Delta]}dt\\ & = \frac{\bar{F}_{\phi}(t)}{\mathbb{E}[\Delta]}dt\\ \therefore f_\tau(t)&= \frac{\bar{F}_{\Delta}(t)}{\mathbb{E}[\Delta]} \end{align} $$ where $\bar{F}_{\Delta}$ is the survival function of the per $k^{th}$ customer service distribution $\Delta_k$.

Remaining/residual lifetime

The same process can be followed to obtain $f_r$. However, doing so will only confirm $f_{\tau} = f_r$. The simulations also confirm this.

From these densities, $\mathbb{E}[r]$, $\mathbb{E}[\tau]$ and $\mathbb{E}[\phi]$ can be determined. The next section takes a look at how to derive the expectations via renewal-reward theory instead. This seems appropriate as we are working with the renewal/inspection paradox.

Renewal-reward theory

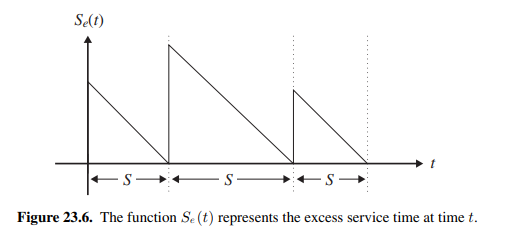
The work up to now comes from the first reference. The second reference takes a renewal-reward theory perspective and places emphasis on finding $\mathbb{E}[\tau]$ and $\mathbb{E}[r]$. It argues that if the system is ergodic then the time-average of a renewal cycle should equal the ensemble average of a cycle (i.e. it expectation). In other words, if we let a renewal cycle constitute a service duration then $$ \begin{align} \mathbb{E}[r] & = \frac{\mathbb{E}[\mbox{total } r \mbox{ earned over }\Delta]}{\mathbb{E}[\Delta]}\\ & = \frac{\mathbb{E}\left[\int_{0}^{\Delta}(\Delta - r)dr\right]}{\mathbb{E}[\Delta]}\\ & = \frac{\mathbb{E}[\Delta^2]}{2\mathbb{E}[\Delta]}. \end{align} $$ The below figure (from the second source) should make this idea clear where $r = S_e$ and $\Delta = S$.

enter image description here

The same can be done for $\mathbb{E}[\tau]$ where the triangles grow in reverse. The result should be $\mathbb{E}[r] = \mathbb{E}[\tau]$.

Bias

We can now determine the bias $\beta$. $$ \begin{align} \beta & = \mathbb{E}[\tau]+\mathbb{E}[r] - \mathbb{E}[\Delta] \\ & = \frac{\mathbb{E}[\Delta^2]}{\mathbb{E}[\Delta]}- \mathbb{E}[\Delta] \\ & = \frac{\mathbb{E}[\Delta^2] - \mathbb{E}[\Delta]^2}{\mathbb{E}[\Delta]} \\ & = \frac{\mbox{Var}(\Delta)}{\mathbb{E}[\Delta]}\\ & = C_V^2(\Delta)\mathbb{E}[\Delta] \end{align} $$ where $C_V^2(\Delta)$ is the coefficient of variation. We see that variation is what increases bias. This is an interesting result because it explains a lot about why queues form even though the service rate exceeds the arrival rate. Due to variance, service intervals appears as long and short realisations. Queues form when arrivals meet a system where a busy server is in a long interval. Intuitively, more variance means more long intervals and more queue growth. As the system is ergodic and the mean service rate is greater than the mean arrival rate then short intervals should empty the queue sometime in the limit/long-run.

Updated code/experiment

# Additional functions

def f_phi(t,f_delta):
    return  t*f_delta.pdf(t)/f_delta.mean()

def f_r(t,f_delta):
    return f_delta.sf(t)/f_delta.mean()

def f_tau(t,f_delta):
    return f_r(t,f_delta)


if __name__ == '__main__':
    # Setup simulation
    alpha = 0.9999  # almost 1 e.g. 1 - 1e-6
    # f_delta = norm(loc=15,scale=3)
    f_delta = gamma(a=0.5,scale=28)  # high cv2 = 2
    # f_delta = gamma(a=3,scale=14/3) # cv2 just below 1
    # f_delta = gamma(a=7,scale=2)  # low cv2
    # f_delta = gamma(a=14,scale=1)  # very low cv2
    # f_delta = gamma1,(scale=14)   # cv2 = 1
    cv2 = f_delta.var()/f_delta.mean()**2
    T = 1000/2   # Run long enough to reach steady state (bit extreme maybe?)
    samples = 5000  # Need a reasonable amount of iid samples
    # Perform simulation
    tau,r,delta = sample_interrupted_services(f_delta,T,samples)
    # Plot empirical pdfs
    fig,ax = plt.subplots(3,1)
    ax[0].hist(tau,bins=80,density=True,alpha=0.5,label='simulated ages')
    ax[1].hist(r,bins=80,density=True,alpha=0.5,label='simulated remainder')
    ax[2].hist(delta,bins=80,density=True,alpha=0.5,label='simulated service durations')
    # Plot algebraic counterparts for comparison
    t = np.linspace(0,f_delta.ppf(alpha),200)
    ax[0].plot(t,f_tau(t,f_delta),label='$f_{\\tau}$')
    ax[1].plot(t,f_r(t,f_delta),label='$f_r$')
    ax[2].plot(t,f_phi(t,f_delta),label='$f_\phi$')
    ax[2].plot(t,f_delta.pdf(t),label='$f_{\Delta}$')
    bias = f_delta.moment(2)/(f_delta.moment(1)) - f_delta.moment(1)
    empirical_bias = delta.mean() - f_delta.mean()
    print('Algebraic bias: ',bias)
    print('Empirical bias: ',empirical_bias)
    # Show legend/labels
    _ = [ax[i].legend(loc='upper right') for i in range(3)]
    fig.show()

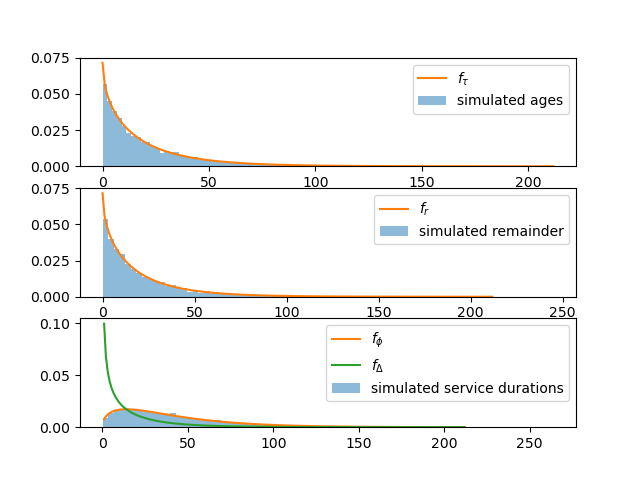
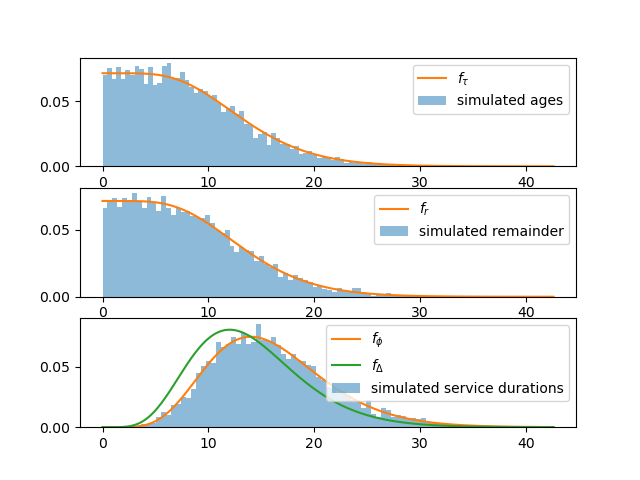
Note: some different options with regards to $C_V^2$ values have been given. We run the experiment for $C_V^2 = 2$ and get a bias of $28$ as opposed to the previous simulation where $C_V^2 = 0.143$ gave $\beta = 2$. Here is the new experiment.

New experiment

Here is the old one.

Old experiment

$\endgroup$

Your Answer

By clicking “Post Your Answer”, you agree to our terms of service and acknowledge you have read our privacy policy.

Not the answer you're looking for? Browse other questions tagged or ask your own question.