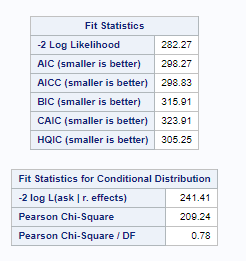
I have a binomial glmm model which I have analysed in both SAS and R. However, I have noticed a difference in the statistics which are given for the random effect. In SAS, there is a table called 'covariance parameter estimates' which gives a p-value for the random effect, along with an estimate, standard error, and z value (see below).
There are also the fit statistics for AIC, BIC, log-likelihood etc.
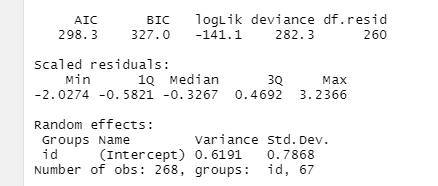
In R, the output from summary(model) gives only the variance and SD for the random effects, which we can see the variance is the same as for the SAS output. The fit statistics are also very similar.
However, as the R output doesn't have a p-value, I then constructed the same model using glm, dropping the random effects, and comparing the two models (glmm and glm) using anova(model_glmm, model_glm)
This gives a similar p-value to SAS, but not the same. We can also see the AIC is still the same as in SAS (although the BIC is again slightly different).
I read elsewhere on this site that it is not actually recommended to report the p-values for random effects. Thus, my question is, should I proceed with trying to figure out a way in R to calculate the p-value generated by SAS (and if so, why is the p-value reported by the chi-square test slightly different?), or should I simply report the output as intended by glmer without the p-value? Or, are there other statistics which I am missing which would be better reported instead?


