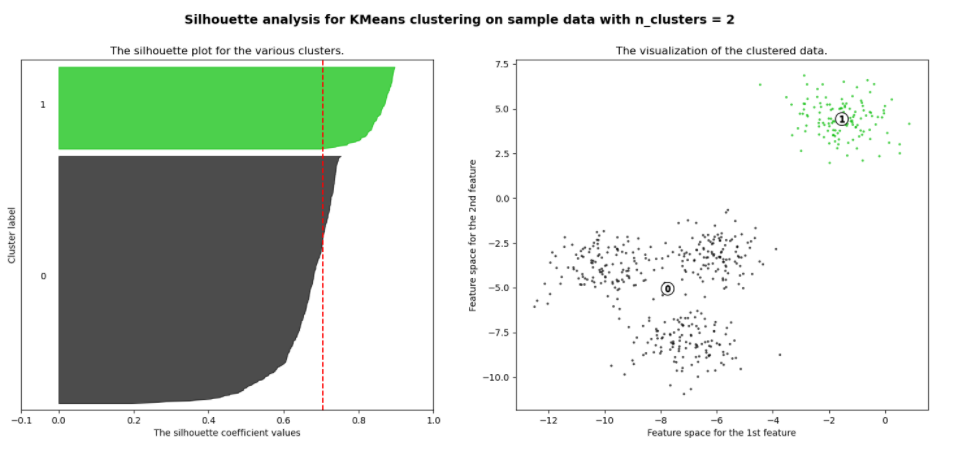
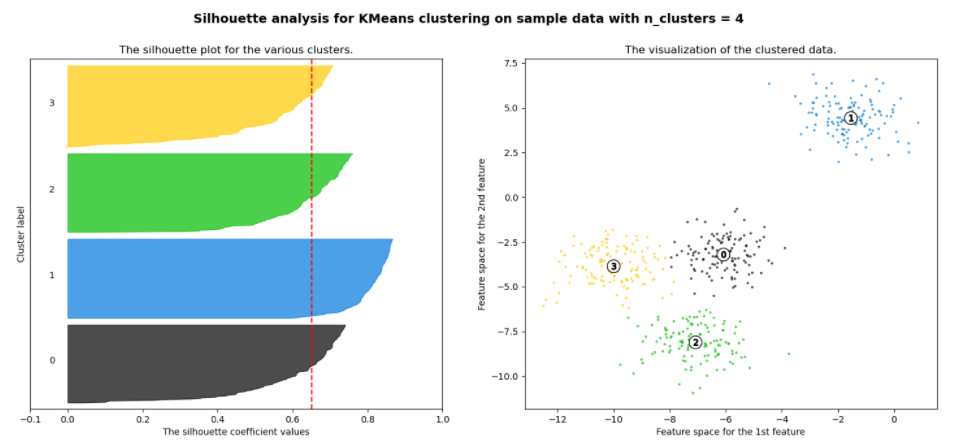
so I was looking back at this tutorial (https://scikit-learn.org/stable/auto_examples/cluster/plot_kmeans_silhouette_analysis.html) and it struck me that the example with clusters=4, the one I would have chosen "visually" was not the one with the highest score. Instead n_clusters=2 was chosen, something I would not have chosen

 below the scores (taken verbatim from the tutorial)
For n_clusters = 2 The average silhouette_score is : 0.7049787496083262
For n_clusters = 3 The average silhouette_score is : 0.5882004012129721
For n_clusters = 4 The average silhouette_score is : 0.6505186632729437
For n_clusters = 5 The average silhouette_score is : 0.56376469026194
For n_clusters = 6 The average silhouette_score is : 0.4504666294372765
what am I missing? what would I need to change to have the option with clusters=4 be the winning one?
