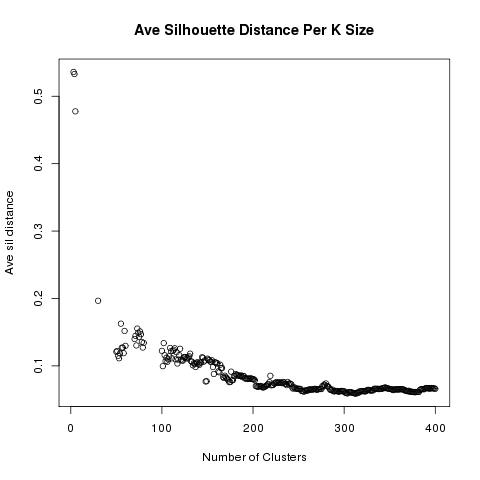
For a microarray experiment with ~40,000 probes and ~30 samples I used the clara function from R to cluster my expression matrix. How do I interpret this silhouette plot?

Firstly, I don't understand how a k of 3 could have the highest sil, considering the algo must be putting together very different genes.
Secondly, many of the clusters for k > 100 have lots of zero and negative scores that is throwing off the average from otherwise tighter clusters (which are the ones I want anyway). How do I improve my choice of k? Is it ok to divide the average silhouette by k? Only take the average of positive silhouettes?
