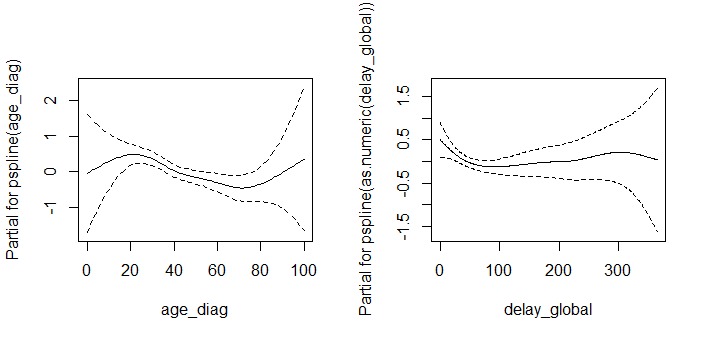
Our working group ran a Cox regression with a p-spline to model the possible non-linearity of continuous variables. However, I'm a bit confused with the interpretation of the linearity or non-linearity of a term.
Here's our model:
CoxModel_spline < -coxph(Surv(as.numeric(time), status) ~
      rurality + pspline(age_diag) + unemployment +
      pspline(as.numeric(delay)), data)

summary(CoxModel_spline)

Call:
coxph(formula = Surv(as.numeric(time), status) ~ rurality +
     pspline(age_diag) + unemployment +
     pspline(as.numeric(delay)), data)

n= 9417, number of events= 298
   (3042 observations deleted due to missingness)

                          coef       se(coef)  se2       Chisq DF   p
ruralityUrban              0.6064811 0.2748575 0.2748049  4.87 1.00 2.7e-02
pspline(age_diag), linear -0.0168872 0.0044320 0.0044315 14.52 1.00 1.4e-04
pspline(age_diag), nonlin                                 5.10 3.02 1.7e-01
unemploymentYes            0.5068094 0.1338692 0.1338014 14.33 1.00 1.5e-04
pspline(as.numeric(delay) -0.0008533 0.0009525 0.0009506  0.80 1.00 3.7e-01
pspline(as.numeric(delay)                                 6.88 3.05 7.8e-02

                          exp(coef) exp(-coef) lower .95 upper .95
ruralityUrban                1.8340     0.5453   1.07012    3.1430
ps(age_diag)3                1.4268     0.7009   0.31525    6.4576
ps(age_diag)4                2.0032     0.4992   0.17119   23.4400
ps(age_diag)5                2.5607     0.3905   0.14375   45.6137
ps(age_diag)6                2.2530     0.4438   0.12276   41.3506
ps(age_diag)7                1.4608     0.6846   0.08268   25.8088
ps(age_diag)8                1.2719     0.7863   0.07201   22.4632
ps(age_diag)9                1.1092     0.9015   0.06213   19.8051
ps(age_diag)10               0.8862     1.1284   0.04899   16.0332
ps(age_diag)11               1.0100     0.9901   0.05490   18.5828
ps(age_diag)12               1.4339     0.6974   0.06977   29.4702
ps(age_diag)13               2.0989     0.4764   0.06566   67.1006
ps(age_diag)14               3.0672     0.3260   0.03830  245.5962
unemploymentYes              1.6600     0.6024   1.27689    2.1580
ps(as.numeric(delay))        0.5518     1.8122   0.21416    1.4218
ps(as.numeric(delay))        0.3398     2.9425   0.09914    1.1649
ps(as.numeric(delay))        0.2985     3.3505   0.09123    0.9764
ps(as.numeric(delay))        0.3013     3.3189   0.09381    0.9678
ps(as.numeric(delay))        0.3209     3.1162   0.09760    1.0551
ps(as.numeric(delay))        0.3396     2.9446   0.10077    1.1445
ps(as.numeric(delay))        0.3357     2.9786   0.09680    1.1643
ps(as.numeric(delay))        0.3795     2.6349   0.10499    1.3719
ps(as.numeric(delay))        0.4296     2.3279   0.11172    1.6518
ps(as.numeric(delay))        0.4153     2.4081   0.09227    1.8689
ps(as.numeric(delay))        0.3537     2.8274   0.04865    2.5713
ps(as.numeric(delay))        0.2988     3.3468   0.01644    5.4298
From my understanding, age_diag is linear, as the non-linear term is non-significant and none of the different coefficients is significant. However, I'm a bit confused with the interpretation of the variable delay as it seems that it's not linear but also not non-linear, considering the significance level of 0.05. However, it does seem odd the variable being nothing. Can we consider the variable non-linear? I'm also inclined to consider the variable non-linear as some coefficients are significant
(**ps(as.numeric(delay))        0.2985     3.3505   0.09123    0.9764
ps(as.numeric(delay))        0.3013     3.3189   0.09381    0.9678**).
What does this mean? I've seen a few questions and read the vignette but it would be helpful to confirm the rationale. The termplot is below and it also seems a bit tricky to understand.
Let me know if further information is needed.

