2
$\begingroup$

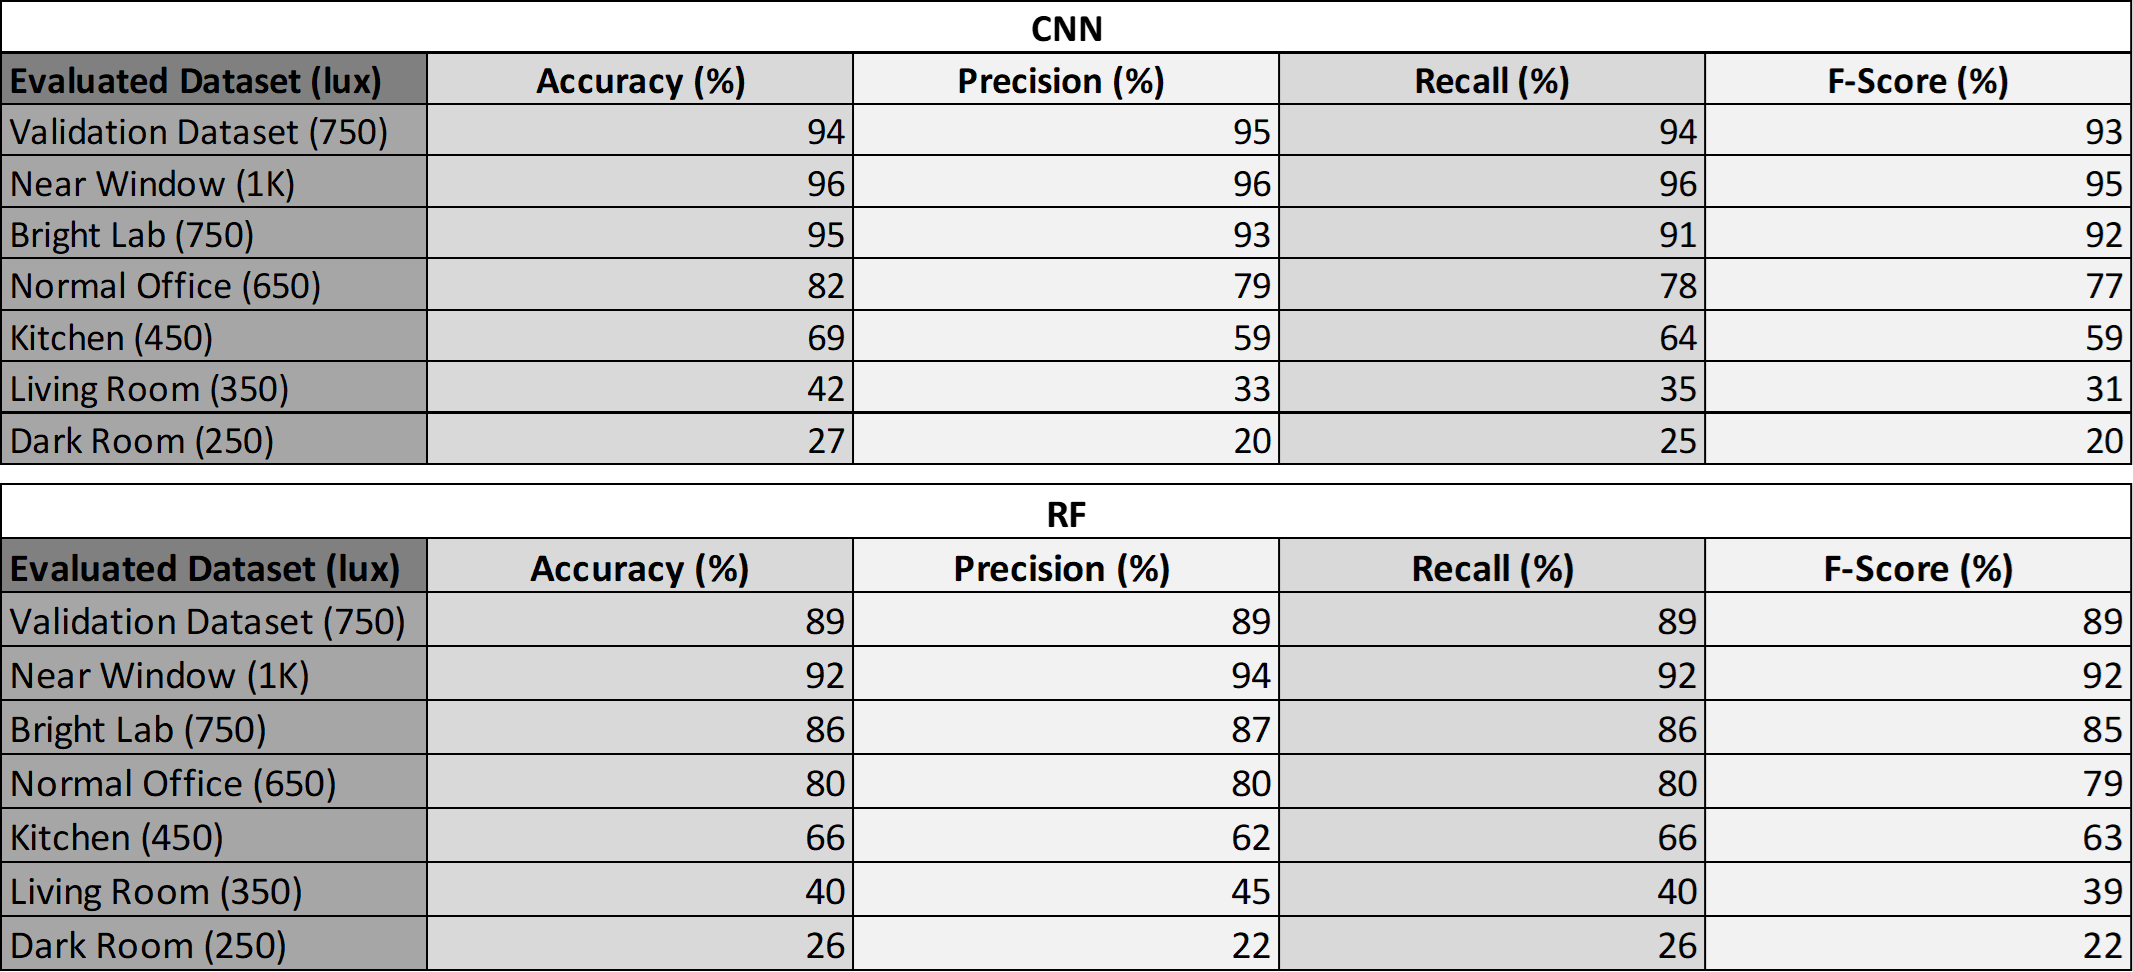
I have trained two models to detect gestures using ambient light and solar panels. I am now testing the two models in different light scenarios. I have a Convolutional Neural Network model that performs slightly better than a Random Forest in terms of accuracy, but in darker intensities (<650 lux), RF outperforms CNN in terms of precision and recall.

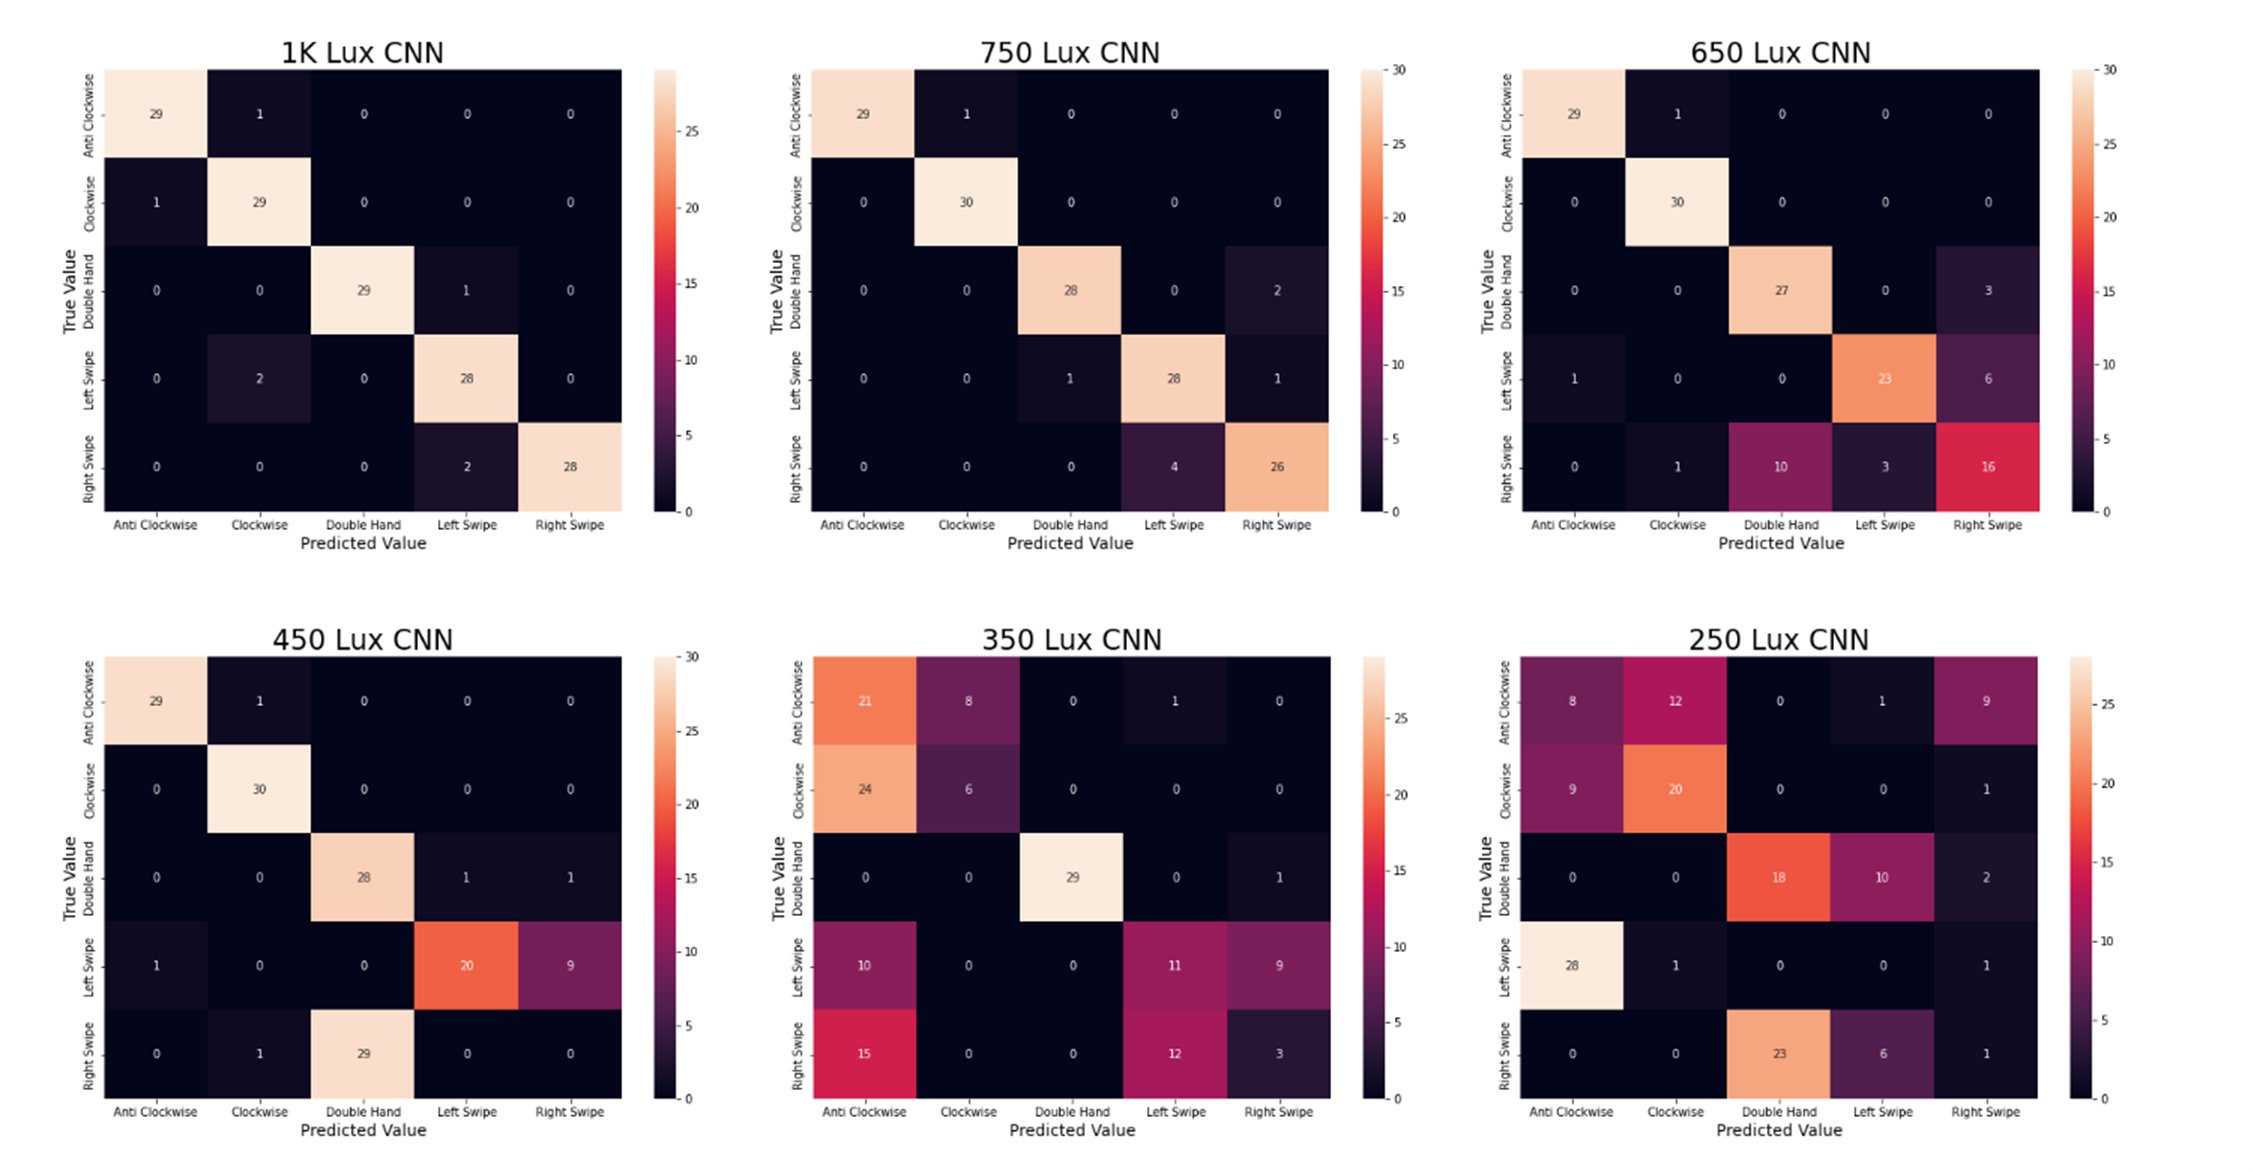
My question is - How can my CNN model have a greater accuracy than precision, recall and F-score? Such as my living room dataset (350 lux).

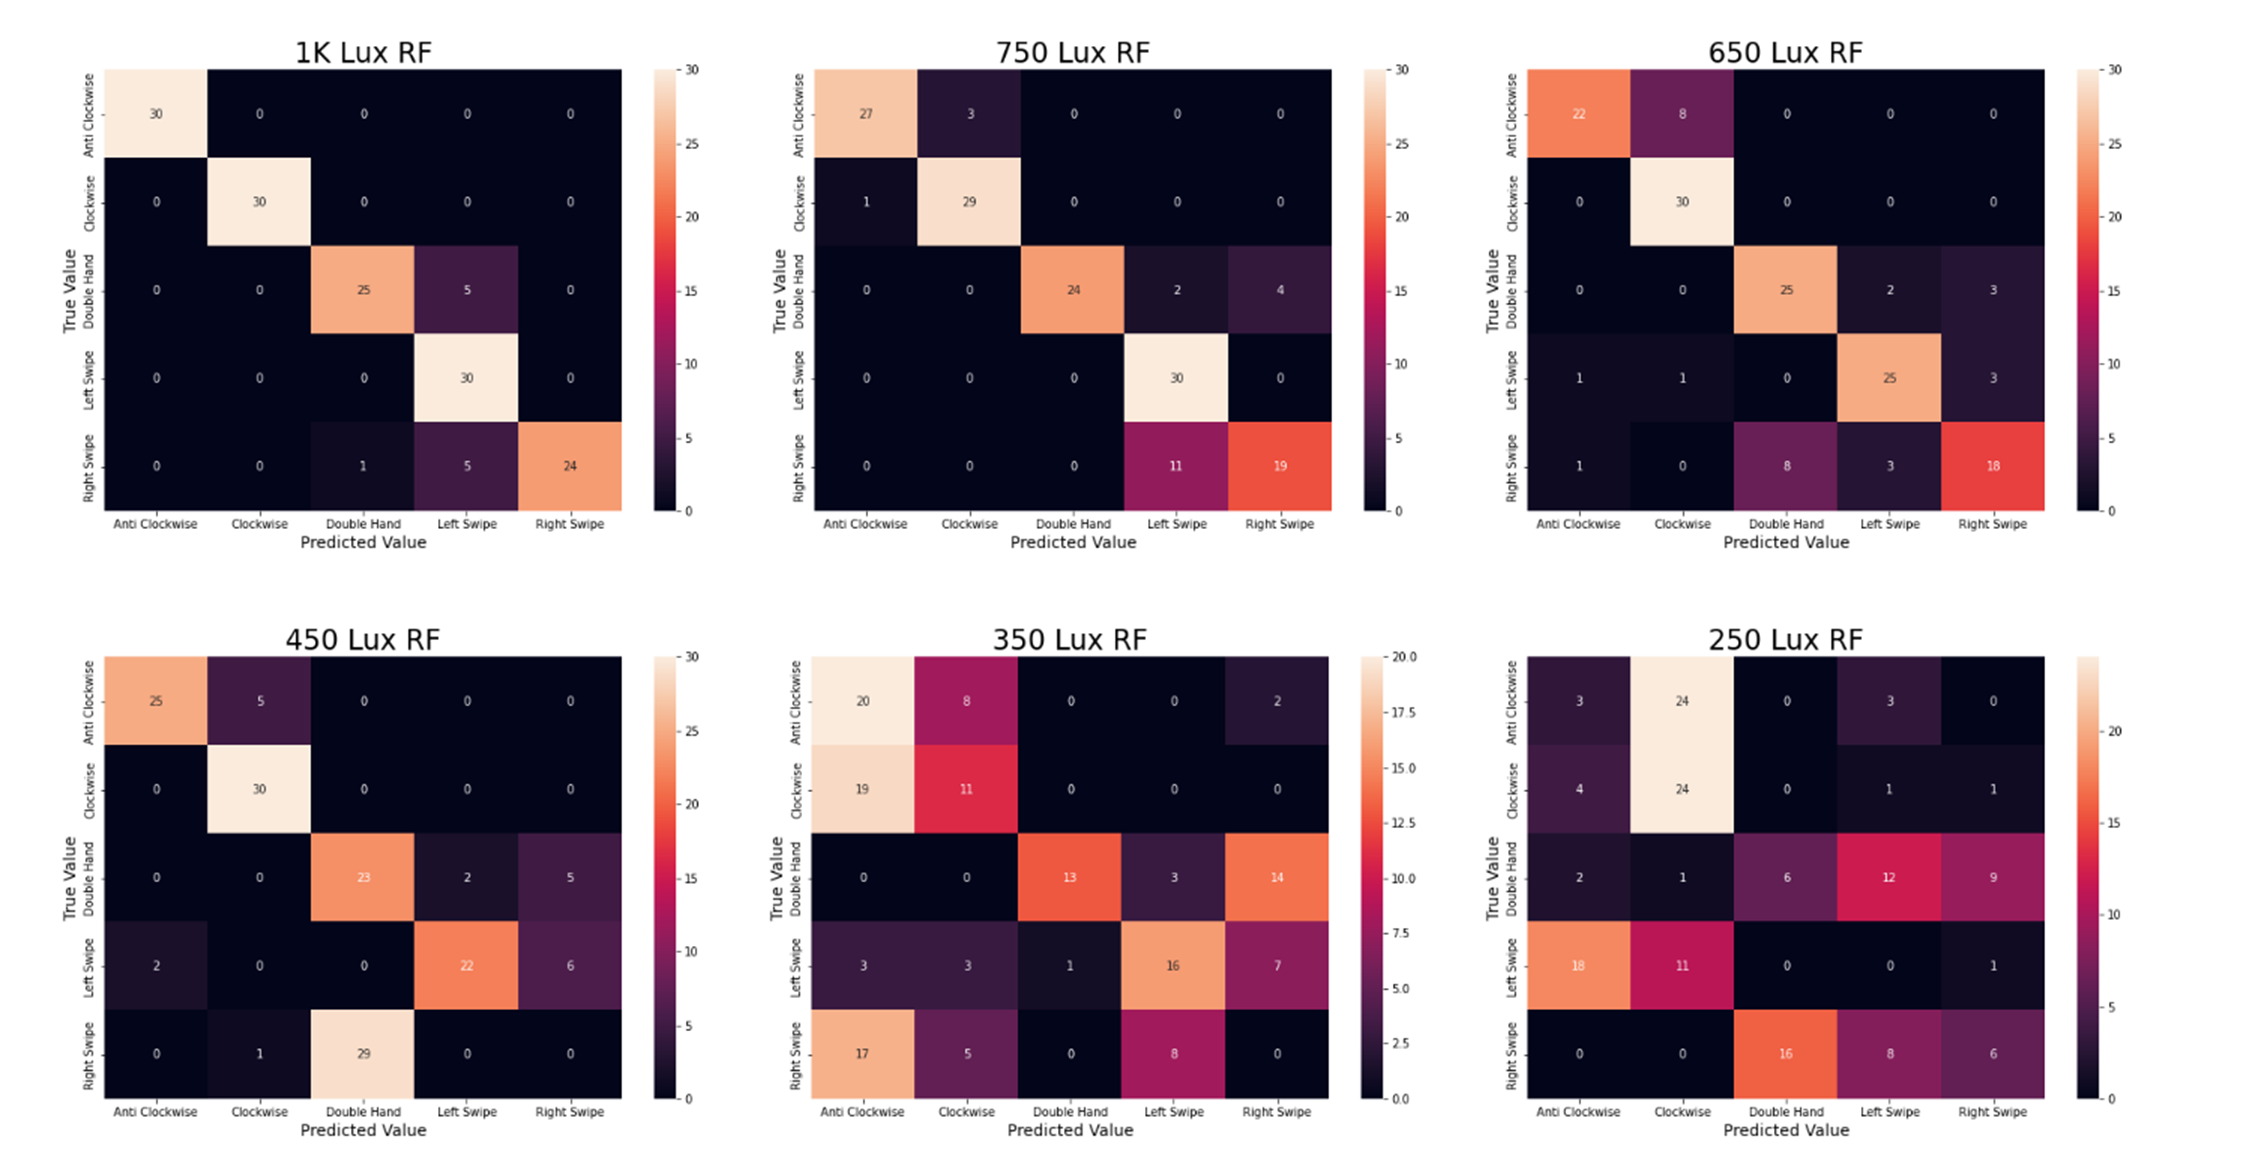
And, how can my RF model after 650 lux outperform CNN in precision, recall and F-score but still receive a lower accuracy score than my CNN.

Could someone please help explain this to me, Thank you in advance

from sklearn.metrics import precision_score, recall_score, f1_score, accuracy_score
from sklearn.metrics import confusion_matrix

array_predicted = torch.tensor([])
array_labels =  torch.tensor([])

loss_fn = nn.CrossEntropyLoss()


val_loss = 0
precision, recall, f1, accuracy = [], [], [], []
model.eval()
with torch.no_grad():
    for i,(data, label) in enumerate(test_loader):
        outputs = model(data.to(device))
        val_loss += loss_fn(outputs, label.to(device))

        predicted_classes = torch.max(outputs, 1)[1] # get class from network's prediction

        array_predicted = torch.cat((array_predicted.cpu(),predicted_classes.cpu()),0) 
        array_labels = torch.cat((array_labels.cpu(), label.cpu()),0)

        # calculate P/R/F1/A metrics for batch
        for acc, metric in zip((precision, recall, f1), 
                                (precision_score, recall_score, f1_score)):
            acc.append(
                metric(label.cpu(), predicted_classes.cpu(), average="macro")
            )
        accuracy.append(accuracy_score(label.cpu(), predicted_classes.cpu()))

[sum(x*100)//len(x) for x in [precision, recall, f1, accuracy]]

Results Table CNN Confusion Matrix RF Confusion Matrix

$\endgroup$
3
  • $\begingroup$ Why are you F-scores smaller than precision and recall? It should be in between them since this is a harmonic mean. $\endgroup$
    – gunes
    Commented Dec 11, 2021 at 12:23
  • $\begingroup$ I have added my code above - I have used macro averaging, this may the reason why? A macro-average will compute the metric independently for each class and then take the average (hence treating all classes equally). Would this be the correct way for doing this $\endgroup$
    – Quine
    Commented Dec 11, 2021 at 14:42
  • $\begingroup$ I guess macro averaging may relax that relation. $\endgroup$
    – gunes
    Commented Dec 12, 2021 at 16:36

2 Answers 2

4
$\begingroup$

We can quite quickly look at all possible combinations where $1\leq TP, FP, TN, FN\leq 10$ (there are only $10^4=10,000$ combinations) and easily see that there are many combinations where the accuracy is higher than precision, recall and F1 score. In R:

TP <- FP <- TN <- FN <- 1:10

combos <- expand.grid(TP,FP,TN,FN)
names(combos) <- c("TP","FP","TN","FN")
combos$precision <- with(combos,TP/(TP+FP))
combos$recall <- with(combos,TP/(TP+FN))
combos$F1 <- with(combos,2*TP/(2*TP+FP+FN))
combos$accuracy <- with(combos,(TP+TN)/(TP+TN+FP+FN))

head(subset(combos,accuracy>apply(combos[,c("precision","recall","F1")],1,max)))

Here is the output, which only shows the first six combinations that satisfy your criterion:

    TP FP TN FN precision    recall        F1  accuracy
101  1  1  2  1 0.5000000 0.5000000 0.5000000 0.6000000
201  1  1  3  1 0.5000000 0.5000000 0.5000000 0.6666667
202  2  1  3  1 0.6666667 0.6666667 0.6666667 0.7142857
211  1  2  3  1 0.3333333 0.5000000 0.4000000 0.5714286
301  1  1  4  1 0.5000000 0.5000000 0.5000000 0.7142857
302  2  1  4  1 0.6666667 0.6666667 0.6666667 0.7500000

It turns out that out of our $10,000$ possible combinations, no less than $2,386$ satisfy the criterion:

> sum(combos$accuracy>apply(combos[,c("precision","recall","F1")],1,max))
[1] 2386

This shows that there is no general relationship between precision, recall, F1 and accuracy (beyond F1 being defined as the harmonic mean of precision and recall).


Note that all these measures suffer from similar weaknesses. All the criticisms against accuracy at these threads apply equally to the other KPIs:

Instead, it is better to use probabilistic classifications, and evaluate these using proper scoring rules.

$\endgroup$
1
  • $\begingroup$ (+1) OP uses macro-averaging, so even if the relationship were true (which is not as you demonstrated), I don't think it'd still be true using macro-averaging. Even the loose relationships between precision/recall and F1 score do not hold. $\endgroup$
    – gunes
    Commented Dec 12, 2021 at 16:38
0
$\begingroup$

I would like to comment with a question first, but I can't so I will try to write an answer.

Is your dataset balanced?

This question is very important. Accuracy is very sensitive to dataset imbalance. In such cases, balanced accuracy is more appropriate and will give you a better value.

Consider a sample with 95 negative and 5 positive values. Classifying all values as negative in this case gives 0.95 accuracy score [...] For the previous example (95 negative and 5 positive samples), classifying all as negative gives 0.5 balanced accuracy score (the maximum bACC score is one), which is equivalent to the expected value of a random guess in a balanced data set. Wikipedia

$\endgroup$
7
  • 1
    $\begingroup$ All datasets contain 150 gesture instances. And the same datasets were used for both CNN and RF testing $\endgroup$
    – Quine
    Commented Dec 11, 2021 at 12:35
  • $\begingroup$ And I assume you have ~30 cases for each of the 5 gestures, right? $\endgroup$ Commented Dec 11, 2021 at 12:45
  • 1
    $\begingroup$ Accuracy, precision, recall and F1 are problematic even for balanced data. See also here. $\endgroup$ Commented Dec 11, 2021 at 12:55
  • 1
    $\begingroup$ That is correct (30 instances x 5 gestures = 150 total gestures) $\endgroup$
    – Quine
    Commented Dec 11, 2021 at 12:55
  • $\begingroup$ I see, Quine. Thanks for the clarifications. I'd go with @StephanKolassa's answer. $\endgroup$ Commented Dec 11, 2021 at 13:10

Your Answer

By clicking “Post Your Answer”, you agree to our terms of service and acknowledge you have read our privacy policy.

Not the answer you're looking for? Browse other questions tagged or ask your own question.