I am just finished my first ever course in statistics and trying to apply it to first ever research problem, so following question might seem little naive.
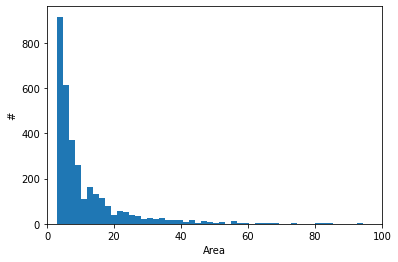
I have data in form of microscopy images of really small particles(see figure below). My hypothesis is that the size distribution (in terms of number of particles for any given area) determined by an automatic script follows the model where observation is sum of shot noise (following exponential distribution) and particle sizes (following log normal distribution).
Can give hints as to how to proceed? I am bit stuck in translating my model to actual equations. Specially how to specify the relation between area and number of observations (tutorials mostly use some polynomials for teaching, but am not sure here.). Below is my attempt:
$$ Obs \sim \chi_{shot} + \chi_{particle} + 3.0\\ \chi_{shot} \sim Exponential(\lambda)\\ \chi_{particle} \sim LogNormal(\mu,\sigma)\\ \lambda \sim Normal(4.0, 2.5) \\ \mu \sim Normal(13.0,5.0\\ \sigma \sim GammaInverse(5.0, 0.5) $$
Here is my failed attempt in numpyro before I gave up
def model(num):
    # smallest observed particle size is 3.0
    lambda_ = npr.sample("lambda_", npr.distributions.Normal(4.0,2.5))
    noise = npr.sample("noise", npr.distributions.Exponential(lambda_))
    pixel_noise = noise + 3.0
    puncta_avg = npr.sample("puncta_avg",npr.distributions.Normal(13.0,5.0))
    puncta_sigma = npr.sample("puncta_sigma",npr.distributions.InverseGamma(5.0,0.5))
    puncta_observed = npr.sample("puncta_observed", npr.distributions.LogNormal(puncta_avg, puncta_sigma))
    observations = npr.sample("obs",puncta_observed + pixel_noise, obs=num)
Histogram of data for help.
Even simple gentle nudge will be helpful.


R, for instance, you could generate lognormal + shot noise data in a single line like(function(n, mu=0, sigma=1) rpois(n, exp(rnorm(n, mu, sigma))))(10, 4.0, 2.5)Is this what you are looking for? $\endgroup$