3
$\begingroup$

I want to use meta-learning, specifically, stacking to combine the results of two algorithms, denoted here A and B. The results of A and B correspond to the first and second columns in the dataset 'dataset.csv' in the link, which are obtained by implementing A and B on a test dataset. The third column in 'dataset.csv' corresponds to the true class label, with 1 for positive class and 0 for negative class.

I used several algorithms as meta learner in MATLAB, including decision tree, logistic regression, naive bayes. Since cross validation was used, the predicted scores on the cross-validated observations were used to plot the ROC curve. The false positive rate and true positive rate were obtained using the code 'CalROCXY.m' in the above link. The results image are following:

I want to know why the performance of stacked model is worse than both of the base learners A and B? Is there something wrong with my workflow and code? Or it is just possible situation for meta-learning which might be due to the quality of my dataset.

Following is the main body of my Matlab code:

clear;
clc;

df = readtable('C:\Users\tuna\Desktop\dataset.csv');
X = df{:, 1:2};
Y = df{:, 3};
% Stacking algorithm A and B (with cross-validation):
% Mdl_tree = fitctree(X, Y, 'MaxNumSplits', 2, 'Leaveout', 'on');
% [Label,NegLoss,PBScore,Posterior] = kfoldPredict(Mdl_tree);

% Mdl = fitclinear(X, Y, 'Learner',"logistic",'CrossVal', 'on');
Mdl = fitcnb(X, Y,"CrossVal", 'on');
[label, PBScore] = kfoldPredict(Mdl);

% Evaluate performance using ROC curve:
[fpr_AE, tpr_AE, auc_AE] = CalROCXY([X(:, 1), Y]);
[fpr_LSA, tpr_LSA, auc_LSA] = CalROCXY([X(:, 2), Y]);
[fpr_Stack, tpr_Stack, auc_Stack] = CalROCXY([PBScore(:,2), Y]);

figure('Position', [50, 50, 400, 300]);
h1 = plot(fpr_AE, tpr_AE, 'b-', 'LineWidth', 1);hold on;
h2 = plot(fpr_LSA, tpr_LSA, 'r-', 'LineWidth', 1);
h3 = plot(fpr_Stack, tpr_Stack, 'm-', 'LineWidth', 1);
axis equal;axis tight;
plot([0, 1], [0, 1], 'k--');
xlabel('FPR');
ylabel('TPR');
legend([h1, h2, h3], {['AE(auc=', num2str(roundn(auc_AE, -2)), ')'], ...
                  ['LSA(auc=', num2str(roundn(auc_LSA, -2)), ')'], ...
                  ['Stacking(auc=', num2str(roundn(auc_Stack, -2)), ')']}, ...
                  'Location', 'southeast', 'Box',"off");
$\endgroup$
0

3 Answers 3

4
$\begingroup$

By using stacking you are including an extra step that the machine needs to learn. You need to spend data on this which means that it is not only able to improve the situation but can also make it worse.

  • Did you still train the individual base learners with the same data before the step with the meta learner? Possibly your algorithm allocates less data for this learning step because it also needs to train and validate the stacking.

  • And how good is this last training step? If the training is done badly then this stacking step can ruin the otherwise good models. Anyways, with two models you are not gonna improve much. How are you gonna stack them when one says the class is 1 and the other says the class is 0? A man with a watch knows what time it is. A man with two watches is never sure. This is why ships used to take three clocks along and not two.


Besides the above considerations, it might be that the different classifiers can have a difficult correlation for classes such that a combination of the classifier works out badly.

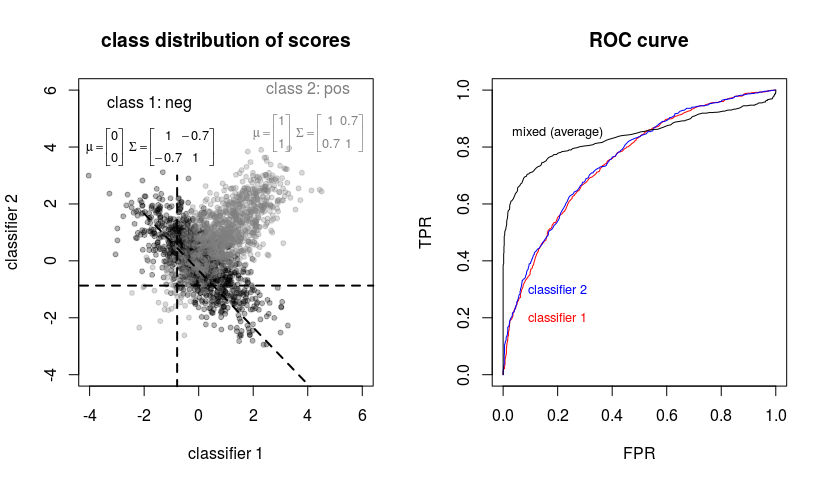
Below is an example where the correlation between the two classifiers is negative for the one class but positive for the other. E.g. if the class 2 is the positive case then the two classifiers often agree on the positive case class, but disagree on the negative case classes.

In the right image, we see what happens when we would use an average of the two classifiers. For the high TPR rates the FPR is worse.

Back to the left image, it is this part on the lower left of the 'class 2' that is difficult to classify when we combine the two classifiers according to some weighted mean. We have plotted three boundary lines that relate to a False Positive Rate of 0.8. The horizontal and vertical boundary lines (using only a single of the classifiers) do better than the diagonal line (relating to a mean of the classifiers).

example

I have tried to replicate the above images for your case. It is slightly present as well. We can ascribe this to the situation where you have only 32 data points. This makes it easier that you randomly get such peculiar situation.

Something that I can not reproduce is the situation where you have very low initial TPR. The ROC curve for the individual base learners rapidly increases to above 0.5 without an increase in FPR. We do not see this in the stacked model. It is unclear what sort of combination of the two base learners is making such error and it seems like this might be a coding error. When I simply use the average of the two classifiers then I do not get this discrepancy.

I guess that your data in 'dataset.csv' relates to the logistic regression. Here the stacked regression is not doing so bad. The only point where it is worse than the two models together is around the point FPR = 0.7 and TPR = 0.85.

If you provide the dataset for the other cases, then we can see if it corresponds to the example above. Plots of the scores for the two classifier scores will give some insight.

$\endgroup$
2
  • $\begingroup$ @emberbillow This is unclear to me. The hypermodel has hyperparameters that need to be tuned, that means training and validating, or are you just using the average? How did you make the decision tree without any training and validation? Is your entire data set only 32 examples? $\endgroup$ Commented Jan 23, 2022 at 9:11
  • $\begingroup$ Thank you for your answer. Could you please share the codes for the example listed above? $\endgroup$
    – tunar
    Commented Jan 24, 2022 at 2:52
1
$\begingroup$

A popular post about 'stacking' can be found here: Ensemble Learning: Why is Model Stacking Effective?. The author said that 'stacking' can easily improve the performance with respect to the individual base learners. But I found it not that easy, at least in my project.

Many posts said the key for stacking to work consists in many different base learners are used. From my understanding, it is like the Fourier series in which a complex function can be approximated by a series of triangular base functions. It required that the base triangular fucntions are different in frequency, in other words, they represent different characteristics of the objective functions. In model stacking, we also required the base learners to be different that can capture different features of the underlying complex functions.

Actually, I calculated the simple Pearson correlation of the two methods A and B in the question, and found the correlation coefficient to be only 0.2. I am not sure whether it indicates being different enough for stacking. If they are not that different, or they both underestimate or overestiamte the result on average, then the stacking can never improve the performance whatever meta-learner was used?

$\endgroup$
0
$\begingroup$

In my understanding, what you observed was overfitting stemming from data mispartitioning.

Most likely, you have trained your stacking metamodel on the same data rows that were used for training base models. The correct approach would be to:

  1. split entire data into "base" and "ensemble" sets;
  2. use base set for training base models;
  3. issue predictions of base models using features from the ensemble set as inputs, persist results;
  4. train your meta-learner(s) using results produced in step 3 as inputs, and labels from the ensemble set as targets (feel free to split the ensemble set into train/val parts for early stopping)

Note that the ensemble set must not be accessible for training base models in any way, even indirectly (ie, must not serve as a validation set for base models, etc - do not try to save on that and reserve separate validation set for early stopping of base models from within the base set).

However, simpler ensembles like voting/averaging that do not have a target column and do not perform learning per se can be of course applied without reserving a separate set, often leading to better ML metrics due to reduced variance.

$\endgroup$

Not the answer you're looking for? Browse other questions tagged or ask your own question.