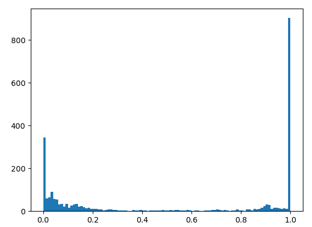
I'm struggling with a challenging optimization problem with real-world experimental data. Simply put, it's about fitting a exponential decay model to a curve (decay). Essentially, I am trying to predict 3 parameters from the curve. The range of expected values for each parameter is well known, so I have set hard boundaries (also to avoid mathematical errors like divide by 0).
If you imagine I have a problem set of hundredths of decays, fitting all of them and making a histogram of each predicted parameter should give somewhat of a normal distribution (roughly) for each parameter. In reality, usually at least two of the parameters are predicted to be at the boundary in 90% of the cases:
This happens wth any method I try, whether non-linear least squares or some of the gradient or gradient-free minimizers.
Can anyone help me out with a professional explanation why this is occurring?

