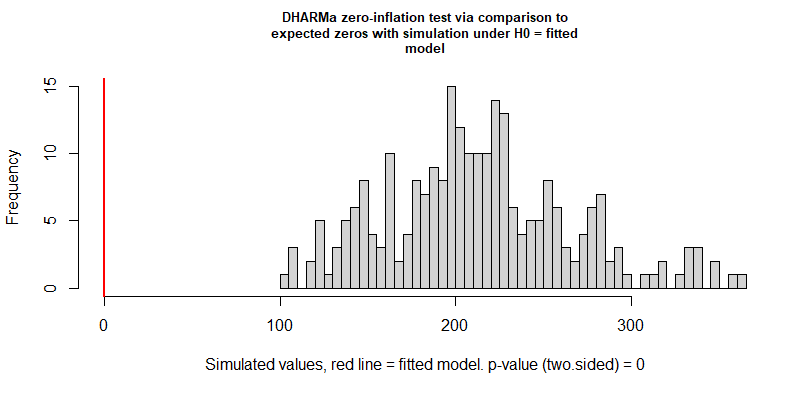
I am investigating feeding rates in great apes. Because I am using count data, I built a generalized linear model with a Poisson link function. So I put the number of items in a bundle as a response and as an offset term the needed time per bundle. We want to see if there is any class difference between the rates. Here the model:
Frates <- glmer(NumberPerBundle ~
                     Class + FoodAvailability + offset(log_TimePerBundle) +
                     (1+ FoodAvailability|FoodItem) + (1|ID),
                  family = poisson,
                  data = Frates)
Now I checked for zero inflation in my model with the DHARMa package:
testZeroInflation(Frates)
    # DHARMa zero-inflation test via comparison to expected zeros with
    # simulation under H0 = fitted model

    data:  simulationOutput
    ratioObsSim = 0, p-value < 2.2e-16
    alternative hypothesis: two.sided
As I interpret this, the test says there is zero inflation in my model, but there are no zeros at all in my data set. The minimum value of number of items per bundle and the time per bundle is 1. Class as well as food item are categorical and food availability has as well no zeros.
That is why I am a bit confused. Hope somebody has an idea.


testZeroInflationhelp page: "The plot shows the expected distribution of zeros against the observed values, the ratioObsSim shows observed vs. simulated zeros. A value < 1 means that the observed data has less zeros than expected, a value > 1 means that it has more zeros than expected (aka zero-inflation)." You haveratioObsSim = 0so there are fewer zeroes in your data than expected from the simulation. See the answer from @AdamO (+1) for helpful details about what's going on in terms of dispersion versus what's expected from a Poisson distirbution. $\endgroup$