0
$\begingroup$

I'm having trouble interpreting my ARIMA results and would like to know what I can do to improve the model.

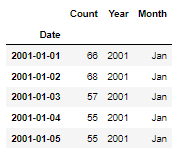
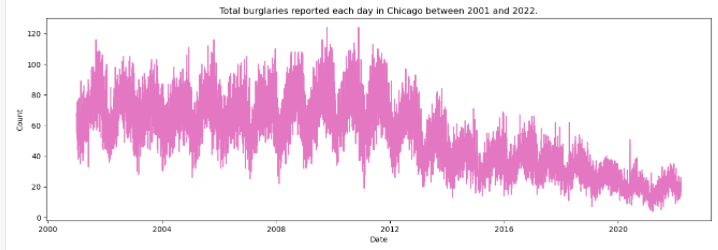
I am working with a crime data set with 7740 entries collected over 21 years which I've structured as daily aggregates:

enter image description here

enter image description here

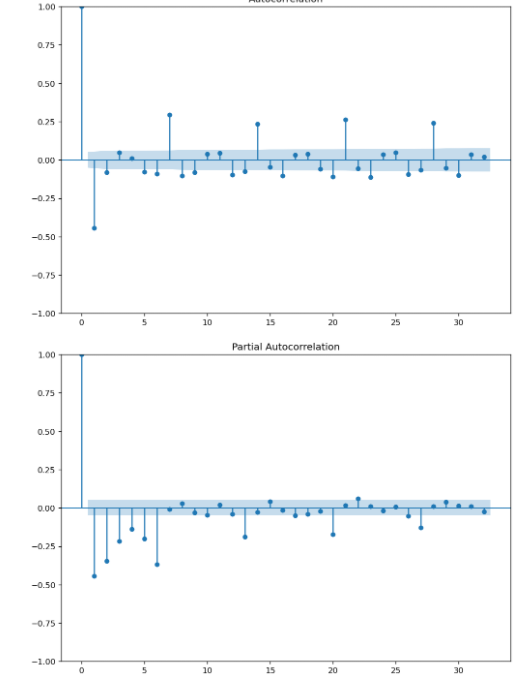
My p,d,q values are 6, 1, and 7.

p and q come from (Using First Order Differencing on data): enter image description here
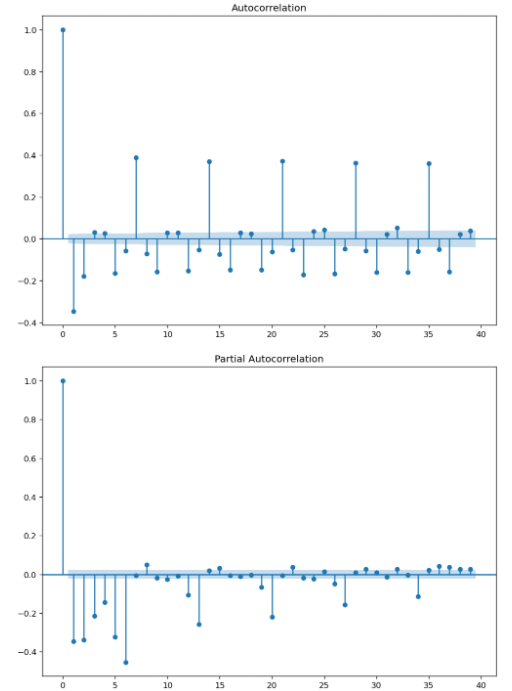
d value of 1 comes from first order differencing rejecting null hypothesis in ADF.

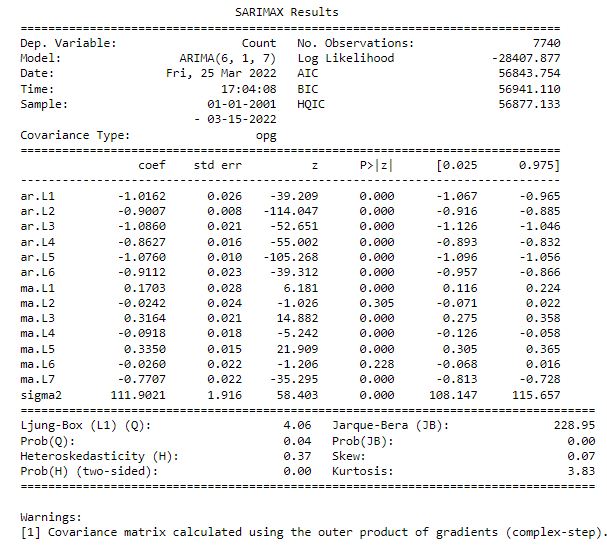
and my model results are:

enter image description here

Have I understood the attainment of p, d ,q values properly? Is my data organised correctly? Are there glaring errors in my model summary that I can correct?

Thanks!

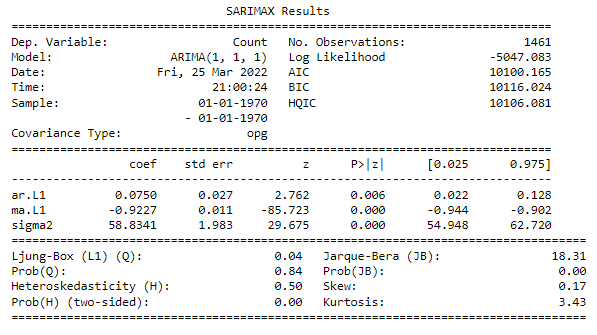
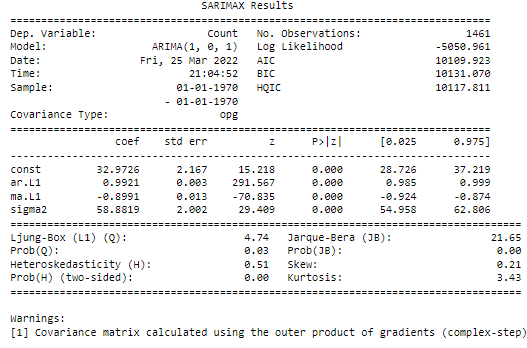
edit: After reducing the spe of the dataset to just 2015 - 2020 to avoid likely structural break, these are my new results:

enter image description here enter image description here

(With no differencing:)

enter image description here

$\endgroup$
6
  • $\begingroup$ Differencing the time series may have been a bad idea. Is there a reason you think there has to be a unit root? The picture does not suggest one, and I do not think the subject-matter logic would support that either. There seems to be seasonality, though. Using Fourier terms could help account for that. $\endgroup$ Commented Mar 25, 2022 at 19:20
  • $\begingroup$ Without differencing the time series I was getting a P value of 0.4 for the ADF test. Differencing also levelled out the distribution plot. I've not come across Fourier terms, where in the workflow would I include this? Thanks! $\endgroup$
    – AMGU
    Commented Mar 25, 2022 at 19:27
  • $\begingroup$ Regarding Fourier, see e.g. robjhyndman.com/hyndsight/longseasonality or robjhyndman.com/hyndsight/forecasting-weekly-data. Regarding ADF, a trained eye can sometimes tell more than a test statistic (but you would have to take my word for it). Fatafim's observation about a structural break could explain why ADF is getting it wrong. $\endgroup$ Commented Mar 25, 2022 at 20:30
  • $\begingroup$ Thank you Richard. I decreased my dataset to only cover 2015 - 2019 as to avoid the likely structural break, the ADF test still came through on the first difference and the new ACF/PACF all gave me a p,d,q of 1,1,1 Please see updated post for new ARIMA results and let me know if I still need to get into seasonality. $\endgroup$
    – AMGU
    Commented Mar 25, 2022 at 21:02
  • 1
    $\begingroup$ The ADF test depends on certain assumptions which would be violated if the data was seasonal and the lag wasn't high enough. You can't just blindly trust the ADF test if you didn't even check if those assumptions are met! $\endgroup$
    – Chris Haug
    Commented Mar 25, 2022 at 21:13

1 Answer 1

0
$\begingroup$

First of all, your data seems to have a structural break - I would see to it with Chow test or Bai Perron test, it might be that a TAR or TARMA model will fit your data better.

Second of all, your dataset seems to have seasonal relationship of some kind - if TAR/TARMA does a bad job, it might be better to simply not take into account the data before the structural break - the more if your goal is forecasting, not modelling. Check out SARIMAX from statsmodels.

Generally speaking, it's a poor idea to check stationarity only with ADF test, it's a better approach to check it with ADF, KPSS and for large datasets also PP test. Since ADF and KPSS have contradictory H0s, if both claim it's stationary, the result will be more reliable.

$\endgroup$

Your Answer

By clicking “Post Your Answer”, you agree to our terms of service and acknowledge you have read our privacy policy.

Not the answer you're looking for? Browse other questions tagged or ask your own question.