0
$\begingroup$

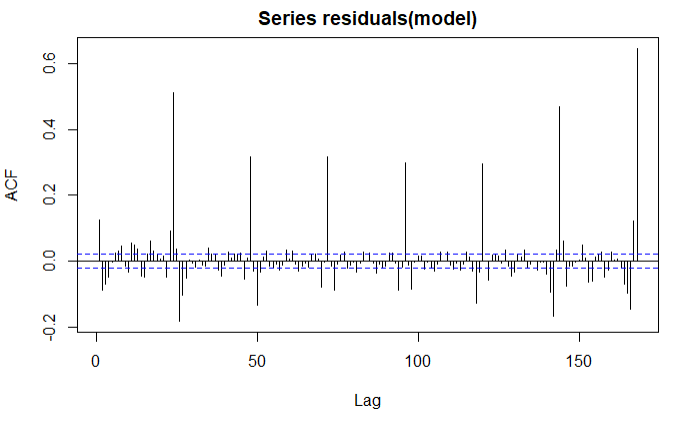
I'm doing a time series forecast (with hourly data), and after plotting the autocorrelation of the residuals, I get a bigger value for every 24th lag (the pikes in the picture). I tried to include the 24th lag of the dependent variable in the model, but no change.

What are my options in this case, if I want to remove the autocorrelation between the residuals?

ACF plot

$\endgroup$

2 Answers 2

3
$\begingroup$

Seasonality can be treated by adding 23 seasonal dummies. Seasonal arma or seasonal differences are often deficient.

The whole idea is that time series modelling requires evaluating alternative approaches thus it is an iterative self-checking process. You have roughly 7 years of hourly data. You have assumed among other things that there is 1 trend and only 1 trend and there are no level or step shifts. You have assumed a 0/1 variable for holidays (assuming all holifdays are similar in their effect) while demand would probably be dependent (for some holidays) on a number of days around specific holidays. You don't know the underlying and waiting to be discovered arima structure including possible first order or seasonal(24) order differencing. You don't know about about any unusual readings but they can distort and obfuscate a useful model.

Furthermore there can be non-constant error variance and/or non-constant parameter changes over time.

You need to use more powerful software that can be useful aid with problems as complicated as yours. Simple tools can sometimes be useful for simple problems . You have a complicated problem , thus you may possibly need to up-armor !

$\endgroup$
4
  • $\begingroup$ I already added the 23 dummies, but even with these, the residuals are autocorrelated. So not sure what can be the problem. $\endgroup$
    – Goba
    Commented Apr 23, 2022 at 19:52
  • $\begingroup$ if you post your data or send it to me at [email protected] , I will try and help you further $\endgroup$
    – IrishStat
    Commented Apr 23, 2022 at 19:56
  • $\begingroup$ Sent you the data via email. $\endgroup$
    – Goba
    Commented Apr 23, 2022 at 20:13
  • $\begingroup$ If you found this answer helpful, then please consider upvoting and/or accepting it. $\endgroup$ Commented Apr 25, 2022 at 13:55
0
$\begingroup$

This shows seasonality in your data, so you have to take the preprocessing step of removing this seasonality (through differencing).

$\endgroup$
1
  • $\begingroup$ The apparemtly seasonal structure can often be the resultd of an omitted set of seasonal pulses (in this case 23 seasonal dummies) rather than an autogressive seasonal structure (lag 24) as you are suggesting. $\endgroup$
    – IrishStat
    Commented Apr 29, 2022 at 18:56

Your Answer

By clicking “Post Your Answer”, you agree to our terms of service and acknowledge you have read our privacy policy.

Not the answer you're looking for? Browse other questions tagged or ask your own question.