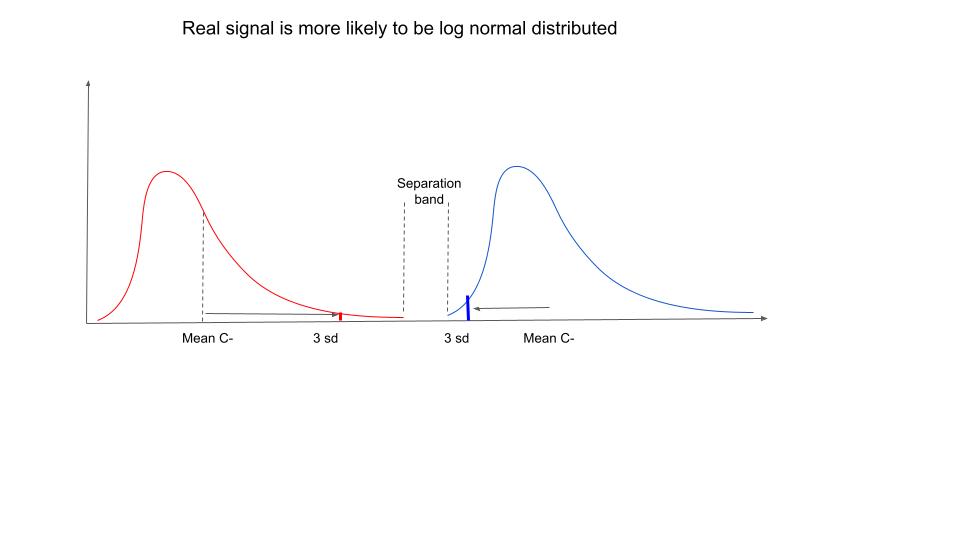
My question/concern is, shouldn’t we adjust for the actual distribution of the data?
Yes. For example, this helpful Technical Perspective on Empowering statistical methods for cellular and molecular biologists illustrates different types of data distributions early on, in Figure 1.
What can happen in practice, however, is that there aren't enough data to determine the actual distribution. Or if there are, you might erroneously gauge that the distribution doesn't match the one you had in mind. See, for example, the extensive discussion on whether normality testing is essentially useless.
The Central Limit Theorem and its implications for the distributions of mean-value estimates, as noted by @Christian Hennig, often can allay your concerns substantially. Tests of differences between samples typically depend on normal distributions of sample means rather than of the raw observations themselves.
In your example with an underlying log-normal distribution, the variance among observations of a sample in the original scale could be a function of the mean value. Although that violates assumptions of some hypothesis tests, the practical problems can be minimal. Within any sample the values might be far enough from 0 and closely enough spaced that the normal-distribution assumption isn't too bad within each sample. Welch's t-test, the default 2-sample test in R, can then take any differences of within-sample variances into account.
That said, if your knowledge of the subject matter suggests a particular distribution then it makes sense to analyze data with that distribution in mind. For example, quantitative polymerase chain reaction (qPCR) data are typically expressed in Cq units, the number of reaction cycles needed to pass some fluorescence-intensity threshold. Those Cq values are logarithmically related (inversely) to the amount of PCR target, with each halving of the target amount leading to a 1 unit increase in Cq.
I routinely do calculations in the Cq scale rather than the target-amount scale, as the data in Cq scale tend to meet the assumptions of regression models better. Residuals in that scale, rather than in the target-amount scale, are more likely to meet the assumption of constant variance across the range of observations. If I need to translate to the target-amount scale, I calculate confidence intervals in the more symmetric Cq scale first and then transform to target amounts.
Generalized linear models (GLM) can allow for explicit handling of specific data distributions. For example, with Poisson-distributed count data (also seen frequently in biology), a Poisson GLM can incorporate the known equality of the mean value and the variance. Logistic regression for binary outcomes incorporates the variance that arises from binomial sampling. With your well-founded concern over how data distributions matter, look into how such models handle this issue and how they also allow for more general relationships between predictor variables and outcome measures.


