0
$\begingroup$

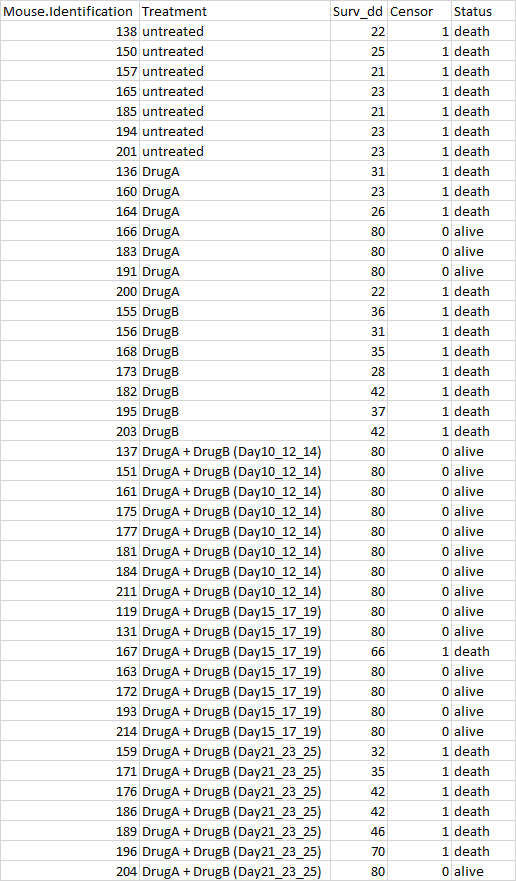
I had a similar data set to what I posted yesterday. I run a Cox-regression model to find the Harzard Ratio between group of interest. I had one group having no event and once that group was set to reference group, the Hazard ratio was just massively large and I received waring from R too. My reference group is flexible as I like to test other groups as reference level. However, as long as I kept the group with no event in the model, I kept receiving warning from R. My key question here is whether it is possbile to remove group with no event from Cox-Model. If I need to keep that group, what is the meaningful interpretation of the massively large Hazard ratio. Interestingly, once I tried to remove group with no event, I did not receive any warning from R at all. I understand this topic is widely discussed; However, I would like the expert to check the ouput and comment specifically on my data. This is a pilot study with small sample size. I really appreciate your time and effort.

### Drug study

Drug<- read.csv("Drug_Cox.csv", stringsAsFactors = TRUE)

## Fit cox regression model with DrugA + DrugB (Day10_12_14) as reference group

## Set reference group

Drug$Treatment= relevel(Drug$Treatment, ref = "DrugA + DrugB (Day10_12_14)")

## First Cox model

summary(coxfit<- coxph(Surv(Surv_dd, Censor) ~ Treatment,
                       data = Drug))

Call:
coxph(formula = Surv(Surv_dd, Censor) ~ Treatment, data = Drug)

  n= 43, number of events= 25 

                                          coef exp(coef)  se(coef)     z Pr(>|z|)    
TreatmentDrugA + DrugB (Day15_17_19) 1.566e+01 6.336e+06 1.040e+00 15.05   <2e-16 ***
TreatmentDrugA                       1.779e+01 5.348e+07 5.880e-01 30.26   <2e-16 ***
TreatmentDrugA + DrugB (Day21_23_25) 1.795e+01 6.253e+07 5.003e-01 35.88   <2e-16 ***
TreatmentDrugB                       1.877e+01 1.424e+08 5.054e-01 37.14   <2e-16 ***
Treatmentuntreated                   2.144e+01 2.052e+09 8.286e-01 25.88   <2e-16 ***
---
Signif. codes:  0 ‘***’ 0.001 ‘**’ 0.01 ‘*’ 0.05 ‘.’ 0.1 ‘ ’ 1

                                     exp(coef) exp(-coef) lower .95 upper .95
TreatmentDrugA + DrugB (Day15_17_19) 6.336e+06  1.578e-07    824561 4.869e+07
TreatmentDrugA                       5.348e+07  1.870e-08  16891516 1.693e+08
TreatmentDrugA + DrugB (Day21_23_25) 6.253e+07  1.599e-08  23457852 1.667e+08
TreatmentDrugB                       1.424e+08  7.021e-09  52891441 3.836e+08
Treatmentuntreated                   2.052e+09  4.873e-10 404477728 1.041e+10

Concordance= 0.845  (se = 0.041 )
Likelihood ratio test= 51.43  on 5 df,   p=7e-10
Wald test            = 4480  on 5 df,   p=<2e-16
Score (logrank) test = 65.62  on 5 df,   p=8e-13

Warning message:
In coxph.fit(X, Y, istrat, offset, init, control, weights = weights,  :
  Ran out of iterations and did not converge

## comment: HR is massively large and also receive warning from R

#=====================================================================================

## Fit cox regression model with DrugA + DrugB (Day15_17_19) as reference group

## Set reference group

Drug$Treatment= relevel(Drug$Treatment, ref = "DrugA + DrugB (Day15_17_19)")

## Second Cox model

summary(coxfit<- coxph(Surv(Surv_dd, Censor) ~ Treatment,
                       data = Drug))

Call:
coxph(formula = Surv(Surv_dd, Censor) ~ Treatment, data = Drug)

  n= 43, number of events= 25 

                                           coef  exp(coef)   se(coef)      z Pr(>|z|)    
TreatmentDrugA + DrugB (Day10_12_14) -1.566e+01  1.578e-07  2.332e+03 -0.007 0.994641    
TreatmentDrugA                        2.133e+00  8.440e+00  5.880e-01  3.627 0.000286 ***
TreatmentDrugA + DrugB (Day21_23_25)  2.289e+00  9.869e+00  5.003e-01  4.576 4.73e-06 ***
TreatmentDrugB                        3.113e+00  2.248e+01  5.054e-01  6.158 7.36e-10 ***
Treatmentuntreated                    5.780e+00  3.238e+02  8.286e-01  6.976 3.03e-12 ***
---
Signif. codes:  0 ‘***’ 0.001 ‘**’ 0.01 ‘*’ 0.05 ‘.’ 0.1 ‘ ’ 1

                                     exp(coef) exp(-coef) lower .95 upper .95
TreatmentDrugA + DrugB (Day10_12_14) 1.578e-07  6.336e+06     0.000       Inf
TreatmentDrugA                       8.440e+00  1.185e-01     2.666     26.72
TreatmentDrugA + DrugB (Day21_23_25) 9.869e+00  1.013e-01     3.702     26.31
TreatmentDrugB                       2.248e+01  4.449e-02     8.347     60.54
Treatmentuntreated                   3.238e+02  3.088e-03    63.834   1642.95

Concordance= 0.845  (se = 0.041 )
Likelihood ratio test= 51.43  on 5 df,   p=7e-10
Wald test            = 120.7  on 5 df,   p=<2e-16
Score (logrank) test = 65.62  on 5 df,   p=8e-13

Warning message:
In coxph.fit(X, Y, istrat, offset, init, control, weights = weights,  :
  Ran out of iterations and did not converge

# Comment: Unusual HR and warning from R

#======================================================================================


## exclude no event group (DrugA + DrugB (Day10_12_17)

## Set reference group

exclude$Treatment= relevel(exclude$Treatment, ref = "DrugA + DrugB (Day15_17_19)")

## Fit cox-regression model 

summary(coxfit<- coxph(Surv(Surv_dd, Censor) ~ Treatment,
                       data = exclude))


Call:
coxph(formula = Surv(Surv_dd, Censor) ~ Treatment, data = exclude)

  n= 35, number of events= 25 

                                        coef exp(coef) se(coef)     z Pr(>|z|)    
TreatmentDrugA                         2.133     8.440    1.119 1.907  0.05658 .  
TreatmentDrugA + DrugB (Day21_23_25)   2.289     9.869    1.087 2.106  0.03519 *  
TreatmentDrugB                         3.113    22.479    1.113 2.797  0.00516 ** 
Treatmentuntreated                     5.780   323.845    1.320 4.380 1.19e-05 ***
---
Signif. codes:  0 ‘***’ 0.001 ‘**’ 0.01 ‘*’ 0.05 ‘.’ 0.1 ‘ ’ 1

                                     exp(coef) exp(-coef) lower .95 upper .95
TreatmentDrugA                           8.440   0.118484     0.942     75.62
TreatmentDrugA + DrugB (Day21_23_25)     9.869   0.101331     1.172     83.08
TreatmentDrugB                          22.479   0.044486     2.538    199.07
Treatmentuntreated                     323.845   0.003088    24.383   4301.17

Concordance= 0.787  (se = 0.053 )
Likelihood ratio test= 35.22  on 4 df,   p=4e-07
Wald test            = 22.46  on 4 df,   p=2e-04
Score (logrank) test = 46.11  on 4 df,   p=2e-09

## No warming from R

enter image description here

$\endgroup$

3 Answers 3

1
$\begingroup$

First, use the untreated group as the reference. With all in that group having events, it will provide the most stable reference against which to compare the other groups. That would seem to make the most sense in your study anyway, as you presumably want to know how each drug combination improves survival versus no treatment.

Second, for this type of pilot study there is probably no real harm in then just ignoring the coefficient for the group with no events. You can't estimate a coefficient without events in the group; you can just say that in your report.

Third, maybe better, you can used a penalized approach like that in the coxphf package. That's used for the related problem of perfect separation in logistic regression. It imposes a penalty on coefficients that should prevent this type of problem, although it will introduce some bias in the coefficient estimates.

Finally, with only 25 events your model is in severe danger of overfitting. You typically need on the order of 15 events per predictor that you are considering in your model. With 6 groups that would mean about 90 events. I recognize that this is a pilot study, but don't be surprised if a more complete study gives substantially different, probably lower-magnitude, coefficient estimates.

$\endgroup$
1
  • $\begingroup$ Dear Edm, very beautiful and comprehensive responses. I will try all your suggest approaches. I like your second approach, but will also try other approaches you mention too. Kind Regards, Synat $\endgroup$
    – synat
    Commented May 20, 2022 at 1:47
2
$\begingroup$

You may want to reconsider how your data is set up. All groups that use DrugA or DrugB provide information about the effects of those treatments. Thus, if you remove the group without events, you remove not just this group but also information about 'DrugB' from the analysis.

One way to avoid the problematic group without removing it and to obtain more information about each drug is to break your "groups" into a set of variables:

h(t) = DrugA + DrugB + timing_DrugB

This approach will allow you to populate a model that makes full use of all the information (eg, no treatment drug type, timing of DrugB) that may be lost by grouping the data.

Perhaps with your knowledge of the disease and treatment, you can create a model that appropriately represents the components of each group and that is relevant to your hypothesis.

$\endgroup$
2
  • $\begingroup$ Dear Todd, thank for your comprehensive responses. Sounds a great approach to break treatment into a set of variable. I am wondering whether you could kindly explain the timing_DrugB refers to? I did not fully get that point. Kind Regards, Synat $\endgroup$
    – synat
    Commented May 20, 2022 at 1:45
  • $\begingroup$ I see in your data “DrugA +DrugB (Day 15,17,19).” Are these times that B was given in addition A? Maybe A and B were given on days 15, 17, and 19? $\endgroup$
    – Todd D
    Commented May 20, 2022 at 2:54
1
$\begingroup$

This is an example of separation. I.e. the factor for the treatment group where everyone has no event perfectly splits the data so that for one factor level there are no events and for other levels there are some. As a result, the maximum likelihood estimate of the hazard ratio of this group vs. other groups is 0, which is a problem, because we work on the log-scale and $-\infty$ is not a number computer programs will deal with well (or if you reverse the comparison, this the MLE for the hazard ration becomes $+\infty$). What happens internally in the program you use is that it keeps making the estimate smaller (or larger) until it realizes things are not working and then it stops iterating with a warning.

One possible solution for this issue is to use Firth's penalized likelihood approach, or to use median unbiased estimates using exact methods, both of which will produce finite estimates (that will be larger in absolute value, but need to be interpreted with caution). Another very reasonable approach is to do a Bayesian analysis, where you e.g. capture in your prior that interventions usually don't have incredibly large effects on survival, so maybe you think that many interventions might only influence the hazard for death by 10, 20 or maybe 50%, and that maybe 80 or 90 or 95% reduction in the hazard of death is starting to be hard to believe, which you could the capture with some sensible prior on the log-hazard ratio such as e.g. a N(0,1) prior or N(0, 2) or Student-t$_{\nu=3}(0, 2.5)$, or something like that (plus perhaps a prior on what's expected for the untreated based on some historical information).

$\endgroup$
1
  • $\begingroup$ Dear Bjorn, thank for your comprehensive responses and explanation. I learnt a lot from your description. I really appreciated. Kind Regards, Synat. $\endgroup$
    – synat
    Commented May 20, 2022 at 1:48

Your Answer

By clicking “Post Your Answer”, you agree to our terms of service and acknowledge you have read our privacy policy.

Not the answer you're looking for? Browse other questions tagged or ask your own question.