1
$\begingroup$

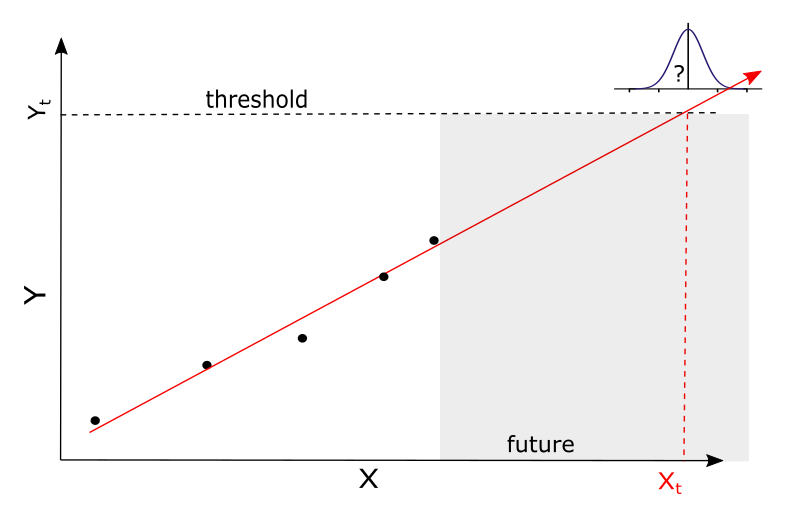
I have a simple 1D set of datapoints with a trend, I want to estimate at which point $X_t$ (i.e., at which point in the future) the model will hit a certain threshold $Y_t$:

enter image description here

I can fit a trendline to estimate the intersection point. But how can I get a probability distribution? I tried to calculate confidence bands and calculate their intersection points, which would give me some information about the "uncertainty" of $X_t$, but it will not give me a continuous probability distribution

I guess it could be done using Bayes Linear Regression, or Bootstrapping? I would be glad to get any advice here and some starting points

$\endgroup$
1

1 Answer 1

0
$\begingroup$

The linear regression model in probabilistic terms is

$$ \mu_t = \beta_0 + \beta_1 x_t \\ y_t \sim \mathcal{N}(\mu_t, \sigma^2) $$

so for any $x_t$, you can calculate the probability that $y_t$ is greater than the threshold

$$ \Pr(Y > y_t|x_t) = 1 - \Pr(Y \le y_t|x_t) = 1 - F_{\mu_t,\sigma^2}(y_t) $$

where $F_{\mu_t,\sigma^2}$ is a normal cumulative probability distribution function with mean $\mu_t$ and variance $\sigma^2$.

$\endgroup$
1
  • $\begingroup$ This, however, does not answer the question that was asked. This formula does not define a probability distribution! $\endgroup$
    – whuber
    Commented May 23, 2022 at 12:54

Your Answer

By clicking “Post Your Answer”, you agree to our terms of service and acknowledge you have read our privacy policy.

Not the answer you're looking for? Browse other questions tagged or ask your own question.