0
$\begingroup$

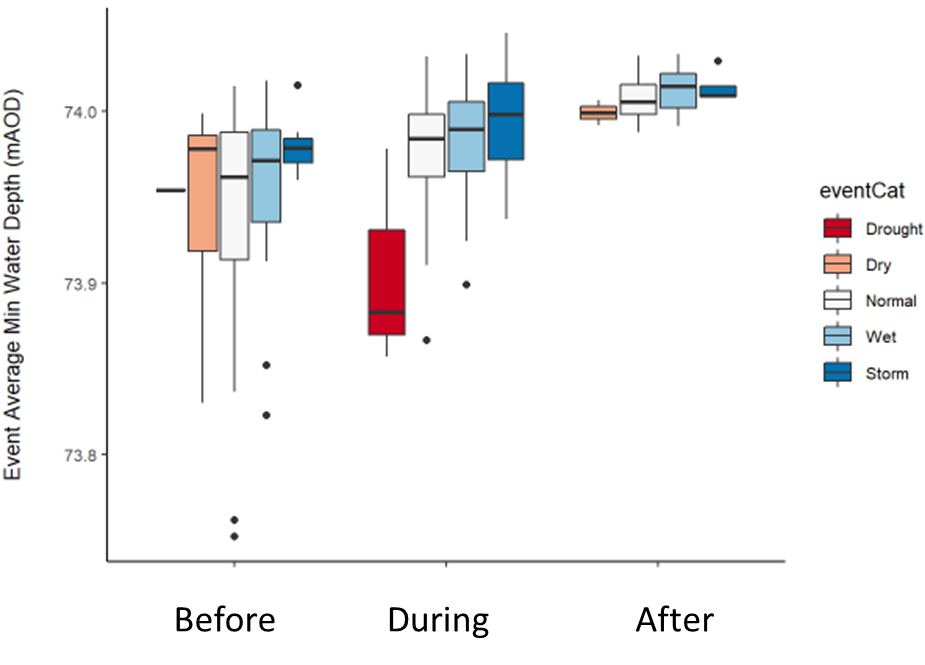
I have a dataset that has three events: before, during and after. For each of these events there are five categories of rain: drought, dry, normal, wet and storm. For each of the categories there is a water level value. The water level data is non-parametric and the data is skewed. The categories are ordinal. What is the best test to use to look at the differences in medians within and between groups?

I have tried a friedman, but I don't know if it is the right test.

I'm using R.

This is an example of the data graphically. I'd like to see whether their is a significant difference within the categories (drought, dry etc.) and between the three events (before, during and after).

enter image description here

EDIT

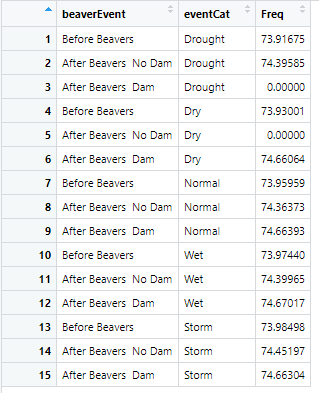
Do you mean something like this?
enter image description here

$\endgroup$
13
  • $\begingroup$ Can you elaborate on what you mean by the data being non-parametric? Are they ordinal? Or skewed? $\endgroup$ Commented Aug 10, 2022 at 10:20
  • $\begingroup$ @DanielDostal see edited question. $\endgroup$ Commented Aug 10, 2022 at 10:24
  • $\begingroup$ Why is Friedmann not right? What about Mann-Whitney-U-Test? $\endgroup$
    – KaPy3141
    Commented Aug 10, 2022 at 10:35
  • 1
    $\begingroup$ You won't be able to use Friedman's test. It simply won't be able to account for both Time and Category simultaneously. More precisely, Friedman's test works only for data in an unreplicated complete block design. ... Aligned ranks transformation anova, as implemented in R, will work for your situation. $\endgroup$ Commented Aug 10, 2022 at 10:58
  • 1
    $\begingroup$ With the caveat that I wrote it, a short description and examples for ART Anova can be found here: rcompanion.org/handbook/F_16.html . $\endgroup$ Commented Aug 10, 2022 at 11:03

1 Answer 1

2
$\begingroup$
  • You won't be able to use Friedman's test. It simply won't be able to account for both Time and Category simultaneously. More precisely, Friedman's test works only for data in an unreplicated complete block design.

  • There may be options to use a generalized linear model (GLM). Or to fit a general linear model (LM) that won't be bothered by the heteroscedasticity in the model. In R, using the white.adjust option in car:Anova may take care of the heteroscedasticity concerns.

  • It sounds like aligned ranks transformation anova (ART anova), as implemented in R, will work for your situation. But this approach is less flexible than using an appropriate GLM or LM.

  • It's not clear to me if you have a repeated measures design. In your study, if you have a variable for Location, where you measured the same Location - Before, During, and After - you would probably want to treat Location as a random effect in the model.

$\endgroup$

Your Answer

By clicking “Post Your Answer”, you agree to our terms of service and acknowledge you have read our privacy policy.

Not the answer you're looking for? Browse other questions tagged or ask your own question.