1
$\begingroup$

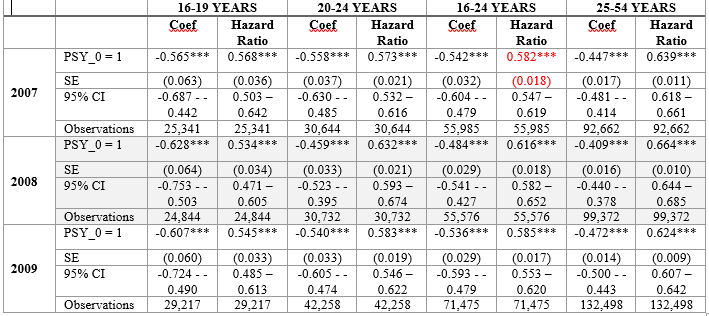
I have done an analysis using Bivariate Cox Proportional Hazards Model Regression, to estimate the rate of exits from unemployment for people with mental illness relative to people without mental illness. I have done this for 2007, 2008 and 2009 (year of inflow into welfare), by age groups and gender. I am a bit confused about how to interpret the data. I am interested to know if people who commenced in 2007 (pre Global FInancial Crisis) had different exit rates than those who commenced in 2009 (in the middle of Global FInancial Crisis). Also if the patters are different for youth compared to older people. Below are the results.

Table below reports the estimated coefficients and standard errors from a bivariate Cox regression with mental illness and no other controls. PSY =1 means the unemployed person has mental illness

enter image description here

$\endgroup$
1
  • $\begingroup$ Welcome to Cross Validated! Did you do separate models for each entry year in question? I can't quite tell from the display. This type of analysis is usually best done with a single model that uses all the data and predictors at once. Then you can readily tell whether there are any differences among the entry years. Also, if you have actual ages you will be better off using age as a continuous predictor, modeled flexibly, rather than categorizing. Also, please edit the question to include how many events occurred and their resolution in time. $\endgroup$
    – EdM
    Commented Aug 16, 2022 at 20:16

0

Your Answer

By clicking “Post Your Answer”, you agree to our terms of service and acknowledge you have read our privacy policy.

Browse other questions tagged or ask your own question.