I spent so many hours trying to create bargraph for lmer in R but I cant find a way to get each condition group mean to vary. I want to plot the following model
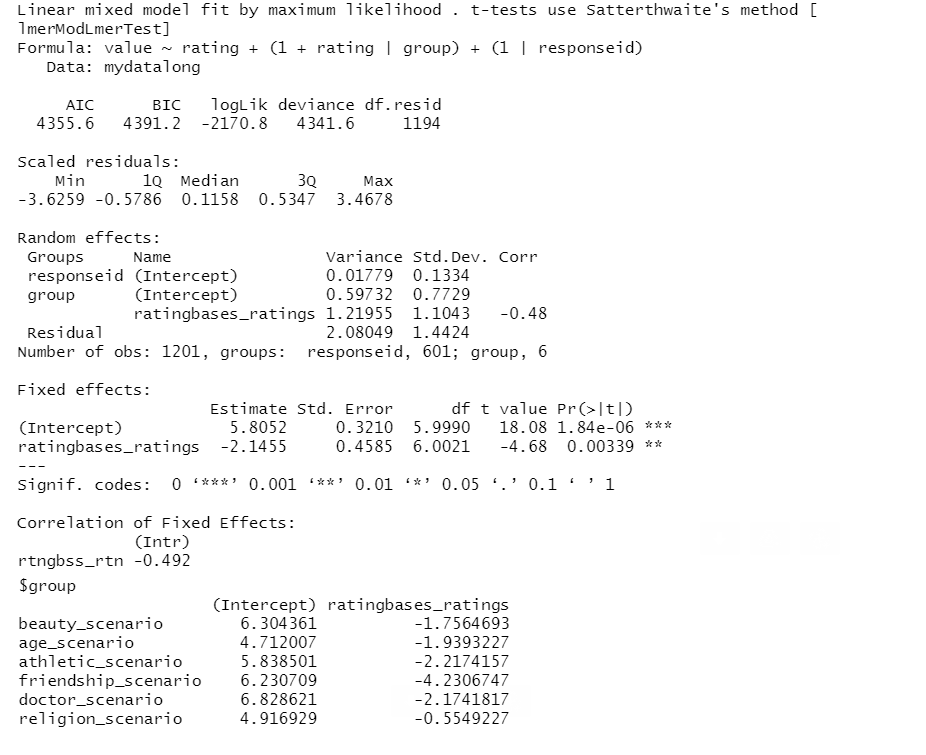
  ratings_long <- lmerTest::lmer(value ~ rating + (1+rating | group) + (1 | responseid), data=mydatalong, REML=F) #control for diff btw
  summary(ratings_long)
  coef(ratings_long)
the code I used for creating the plot
  if (require(lme4, quietly=TRUE)) {
    ratings_long <- lmerTest::lmer(value ~ rating + (1 | group) + (1 | responseid), data=mydatalong, REML=F)
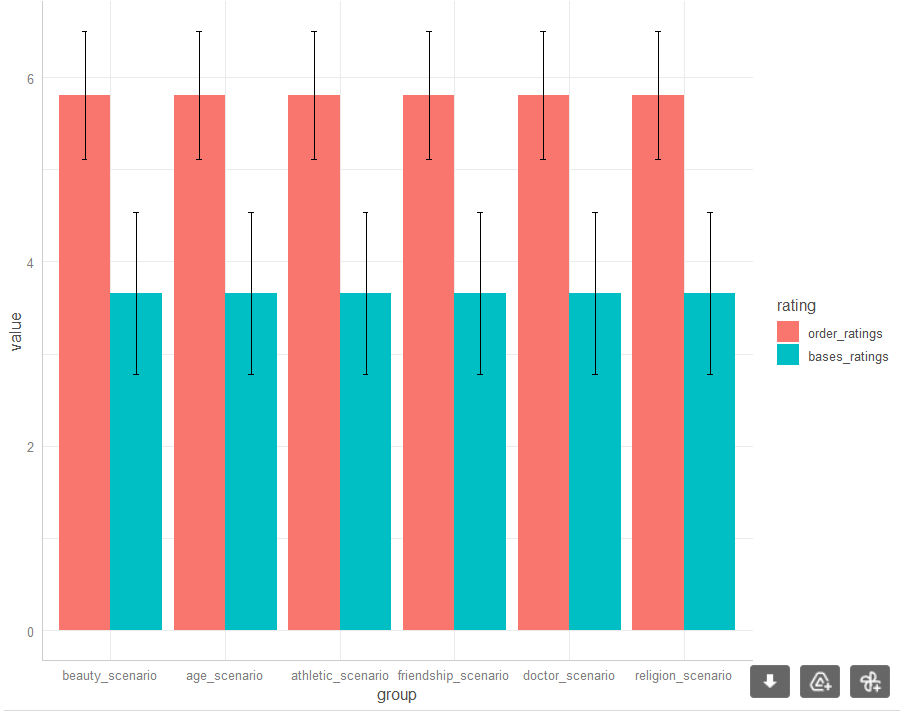
    reghelper::graph_model(ratings_long, y=value, x=rating, lines=group, bargraph=TRUE)
  }

  reghelper::graph_model(ratings_long, value, group, lines=rating, bargraph=TRUE) #doesnt have random effects
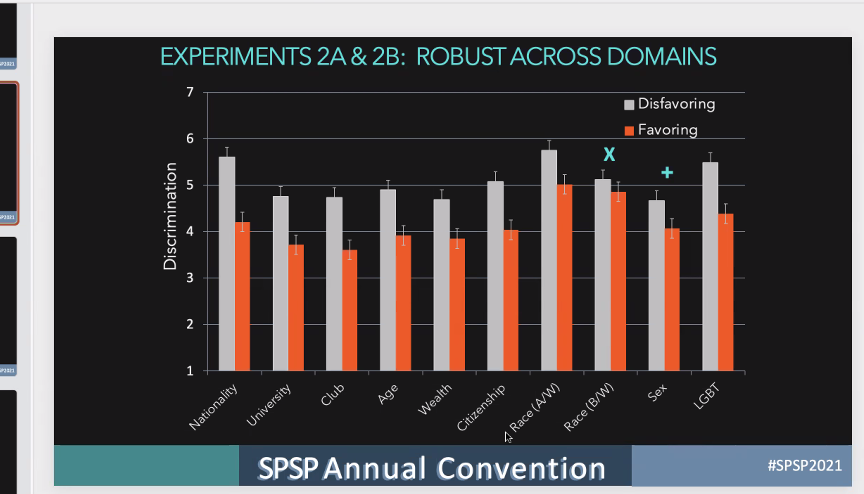
But I want something like this

I know it’s supposed to vary because I ran the lmer model and it says both intercept and slopes significantly differ, which means they are not constant.

Any one aware of what is the problem and solution? The only thing that came up for me was from this site From https://rdrr.io/cran/reghelper/man/graph_model.html (here it says “Details
If there are additional covariates in the model other than what is indicated to be graphed by the function, these variables will be plotted at their respective means. In the case of a categorical covariate, the results will be averaged across all its levels.”) , but this doesn't seem to work as well. Thanks in advance.


value ~ ratingspart of the model, which obviously doesn't vary by group. $\endgroup$