1
$\begingroup$

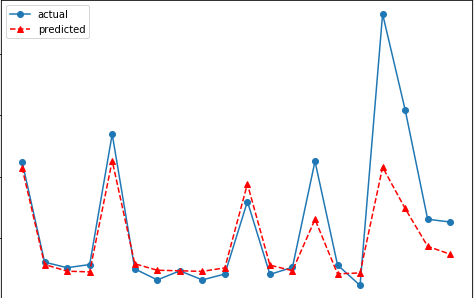
Basically, predicting future values step by step using past values and some covariates as a feature, using some LSTM, Conv layers from tensorflow. I started by using mean absolute percentage error as a loss function, but even when it seems fairly low (<10%) it seems the shape tracking could get a lot better. Consider the following curves (not my results, but should give the idea), for example.

enter image description here

It was generated using mape as a loss, and their loss function is higher than mine, but mine does not trace the curve nicely. So was wondering what is the most appropriate loss function for making sure the peaks and valleys in a test set (i.e. future time steps) are tracked by my model? Best if the loss function is differentiable and available in tensorflow readily. Or else, it has to at least follow the standard api of loss functions such as

def (y_true:Iterable[float], y_pred:Iterable[float])->float:
    raise NotImplementedError
$\endgroup$

1 Answer 1

2
$\begingroup$

There is no "best loss function".

You need to think about what functional of the (unknown) future distribution you want to elicit, then use a loss function that does so. Want the expectation? Use the (R)MSE. Want the median? Use the MAE. Want a quantile? Use a pinball loss. Want the (-1)-median? Use the MAPE. Note that the MAPE may lead to heavily biased forecasts, where "biased" refers to a forecast that is systematically too low compared to the expectation. Which is as it should be, because the MAPE does not aim for an expectation point forecast in the first place, so if you want an expectation forecast, don't use the MAPE. More info can be found in Kolassa (2020).

In the present case, you should first think about whether there is any reason any forecasting system should even in principle be able to anticipate peaks and troughs. The last peak is higher than any peaks before. Do you have predictors that should be helpful at this point in time? If this peak is marked by the exact same Boolean predictor as the peaks before, then you will likely get a forecast that is similar in height to the previous peaks, unless you have seasonality, trend or any other dynamics. See How to know that your machine learning problem is hopeless?

Changing the loss function will not make your algorithm forecast "better" (per above, "better" must be interpreted in the context of the loss function itself!) if the data is not there. The loss function will by itself not provide explanatory information to your algorithm.

$\endgroup$
2
  • $\begingroup$ Thanks a lot for the resourceful answer, and I will go through the references. Just one clarification. I was not necessarily asking only for best-loss-function, but I meant if there is any rule of thumb of best loss function for shape tracking. I understand shape tracking is a qualitative, visual criteria, not something a model can appreciate, but if any specific loss function quantifies it better than most others. $\endgroup$
    – Della
    Commented Aug 20, 2022 at 4:00
  • $\begingroup$ Unfortunately, I do not know of such a metric, I have not come across this question in my forecasting work. You could try a correlation measure (Pearson, Kendall, Spearman) between the forecasts and an entire sequence of corresponding actuals, since shapes naturally pertain to entire sequences of data. A correlation would, however, not notice if your forecasts were systematically biased. You would probably need to think about what precisely means that one model tracks a shape "better" than another one, then find a metric that captures this. $\endgroup$ Commented Aug 20, 2022 at 6:17

Your Answer

By clicking “Post Your Answer”, you agree to our terms of service and acknowledge you have read our privacy policy.

Not the answer you're looking for? Browse other questions tagged or ask your own question.