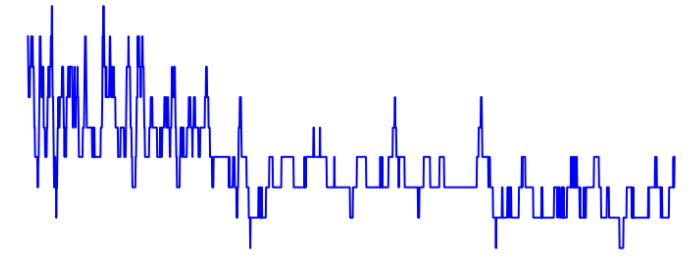
I have a velocity timeseries which is not stationary (Fig. 1). In other words, it is subject to trends and/or seasonality. I would like to report a mean velocity for this timeseries. A common way to do that in my field is to plot the autocorrelation function, take the value x at the zero crossing and then sample the time series using x. That would yield n independent samples.
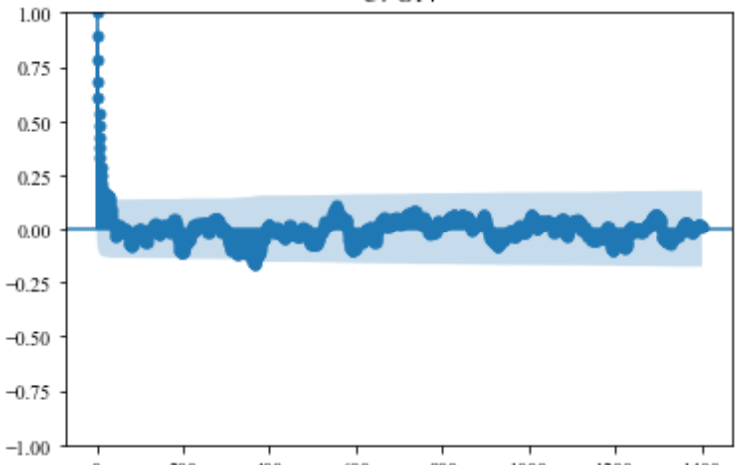
However, my autocorrelation function oscillates (Fig. 2), which, according to Smith et al., 2018, means that my timeseries is anti-correlated, rendering the aforementioned method useless, and that the number of effective samples (Neff) is actually larger than the number of samples (N). To be quite frank, I'm not sure what Neff > N means and how to proceed with the calculation of the mean. The authors suggested bootstrapping but I'm not sure it works for anti-correlated data.
Smith et al., 2018. https://iopscience.iop.org/article/10.1088/1361-6501/aae91d/meta


