4
$\begingroup$

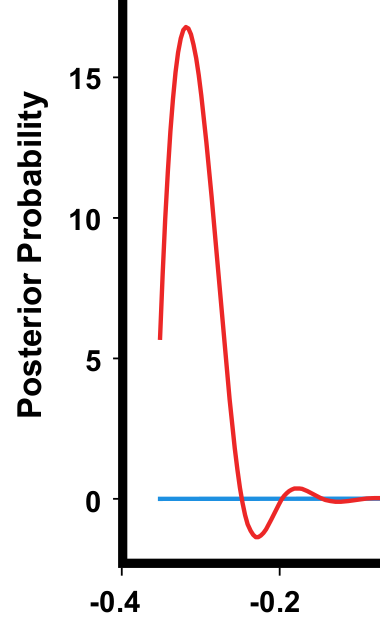
Similar to discussions such as this, I was wondering about the possible values a probability density can have. I get the mathematical reason of why values greater than 1 are possible. However, recently I came across a probability distribution that looked like this:

enter image description here.

Note the dip below zero. The distribution is the result of modeling work that used MCMC sampling to generate parameter estimates. I suspect that there are some problems with the sampling, convergence, or the underlying model, because I don't think negative values were possible, but I am not very certain about it.

Has anyone ever seen something like this and knows whether probability densities with values below zero are possible.

$\endgroup$
5
  • 4
    $\begingroup$ No, it can't. How exactly did you obtain this plot? What does it show? It's unlikely the distribution like this was generated by MCMC because then MCMC would need to generate values with negative probabilities (take away already sampled values?). More likely, you have a bug in the code that generated the plot, or it simply does not show the distribution but something else. $\endgroup$
    – Tim
    Commented Oct 7, 2022 at 14:03
  • 6
    $\begingroup$ This dip is likely an artifact of an inappropriate interpolation algorithm for plotting the density. $\endgroup$
    – whuber
    Commented Oct 7, 2022 at 14:16
  • $\begingroup$ Tim, I am using the library HDDM, and haven't dived into how exactly the plots are produced. @whuber indeed, I just found an old discussion on google groups saying the same thing. Would you mind elaborating how interpolation can cause such a phenomenon? Edit: So the occurrence of such a dip is no evidence for an underlying problem? $\endgroup$
    – userE
    Commented Oct 7, 2022 at 14:23
  • 2
    $\begingroup$ Some interpolators are splines. Imagine placing pins at a few points corresponding to data--so all pins are at or above the horizontal axis. Take a springy piece of wire and bend it to touch all the pins. If, say, it is diving down from the left to touch a pin near $0$ and then has to turn to touch another pin near $0$ at its right, the wire will dip below $0.$ Using such a method is a poor choice for plotting a density! For a detailed analysis of other interpolators that can behave like this, see my post at gis.stackexchange.com/a/14361/664. $\endgroup$
    – whuber
    Commented Oct 7, 2022 at 14:56
  • $\begingroup$ Thanks for the explanation! $\endgroup$
    – userE
    Commented Oct 7, 2022 at 15:01

1 Answer 1

5
$\begingroup$

Classical probabilities are always in the range [0, 1]. A probability density cannot have negative values, because integrating over that region would yield a negative probability, which makes no sense - it would seem to imply that something is less likely than "impossible".

One interpretation of probability in the context of repeatable experiments is that it's simply the proportion of times something occurs, calculated as the number of successes divided by the number of trials. Both of the number of successes and number of trials must be non-negative, therefore the probability must as well.

As pointed out in the comments on the question, one could not find a negative probability through Monte Carlo sampling, as that again boils down to a frequency over many trials, which must be non-negative. What we're likely seeing is a failure of interpolation, where all observed values are in fact positive, but the method used to fit the smooth curve "overshoots" the observed low values near the negative dip.

$\endgroup$

Your Answer

By clicking “Post Your Answer”, you agree to our terms of service and acknowledge you have read our privacy policy.

Not the answer you're looking for? Browse other questions tagged or ask your own question.