2
$\begingroup$

I have to do a PCA in R for a project, but I have 300 data in 15 differents groups, and I want to find the reduced space which gives me the most variability between the groups and cluster my data in their own group ( so not between all the data) so I can do an analysis later while using these variables (I have 4000 very similar variables).

I know how to do the analysis when I want to cluster data that are not already in a group, but I don't know how to do it when I want to find out which variable can separate my groups the best.

The objective is that I use the reduced space that explain the most of the group variability to use them to do analysis, to observe if the data groups are really significantly different when I consider all the data, but I'm not sure if it's actually something possible to do with a ACP.

Thank you!

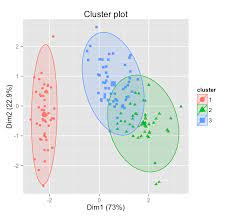
If it makes more sense, I want to see a result like that plot, but the cluster represent the groups I already have to see if they go upon each other, or if they are clearly different. I did a plot before that did not differenciate my data as their group and it was a mess, all mixed up

$\endgroup$
3
  • $\begingroup$ Have a look at ICA. PCA looks at maximizing the variance while ICA search for the best split $\endgroup$
    – Mayeul sgc
    Commented Oct 18, 2022 at 1:25
  • $\begingroup$ I am not sure what method by itself does clustering and discriminant analysis together. Maybe a custom autoencoder? Anyway, here is a Python gist which performs linear discriminant analysis followed by k-means clustering. $\endgroup$
    – Galen
    Commented Oct 18, 2022 at 3:30
  • $\begingroup$ You might want to change the title because my understanding is that you do not need to cluster the data, rather you have clusters already given? $\endgroup$ Commented Oct 18, 2022 at 10:33

1 Answer 1

0
$\begingroup$

There are classical discriminant coordinates, closely related to Fisher's discriminant analysis, that project the data on a low (e.g., 2-d) hyperplane in such a way that ratio between the variation between class means and the variation within classes is maximum. This will give you an, in a well defined sense, optimal 2-d plot separating the clusters. There are also some versions of this taking robustness against outliers into account.

This is implemented in the R-functions plotcluster and discrcoord in my fpc package, see also references on the help pages.

$\endgroup$

Your Answer

By clicking “Post Your Answer”, you agree to our terms of service and acknowledge you have read our privacy policy.

Not the answer you're looking for? Browse other questions tagged or ask your own question.