2
$\begingroup$

My goal is to tune the Classifier with probability predict_proba() < threshold. Therefore, I need to get the threshold.

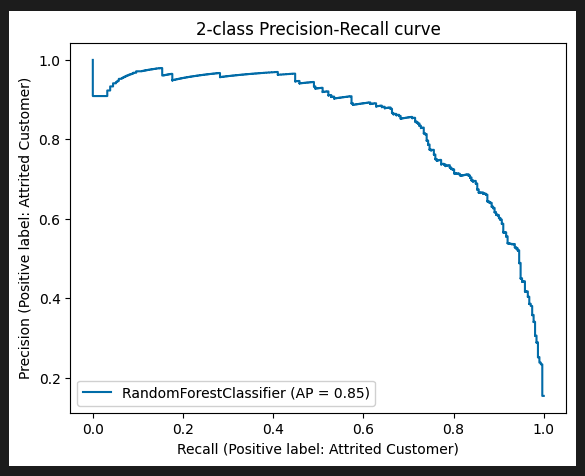
The problem is sklearn.metrics.PrecisionRecallDisplay do not give me the threshold.

scikit-learn.org

The code:

# Model Definition
rf_pipe_tuned = Pipeline(steps=[
    ('composer', composer),
    ('clf', RandomForestClassifier(
        max_depth=17, max_features=9, min_samples_split= 7, n_estimators=27
    ))
])

# Model Training
rf_pipe_tuned.fit(X=X_train, y=y_train)
print("done")

def isolate():
    display = PrecisionRecallDisplay.from_estimator(
        estimator=rf_pipe_tuned, X=X_test, y=y_test, name="RandomForestClassifier",
        pos_label="Attrited Customer"
    )
    _ = display.ax_.set_title("2-class Precision-Recall curve")

isolate()

enter image description here

$\endgroup$

2 Answers 2

0
$\begingroup$

PrecisionRecallDisplay() is just a very basic wrapper for sklearn.metrics.precision_recall_curve(). The latter returns numpy arrays for precision, recall and thresholds, which allow easy vectorized handling, e.g.:

precision, recall, thresholds = precision_recall_curve(target_test, probabilities)
f1_scores = 2 * recall * precision / (recall + precision)
best_thresh = thresholds[np.argmax(f1_scores)]
$\endgroup$
1
$\begingroup$

Expanding on @dx2-66's answer, here is a complete code example that also draws the point where the threshold lies:

from sklearn.metrics import PrecisionRecallDisplay, precision_recall_curve, average_precision_score

# ...
y_true = ...
y_pred = ...
pos_label = 1  # replace with your positive label
name = "My Model". # replace with your desired model name

precision, recall, thresholds = precision_recall_curve(y_true, y_pred, pos_label=pos_label)
f1_scores = 2 * recall * precision / (recall + precision)
best_th_ix = np.nanargmax(f1_scores)
best_thresh = thresholds[best_th_ix]
average_precision = average_precision_score(y_true, y_pred, pos_label=pos_label)
display = PrecisionRecallDisplay(
    precision=precision,
    recall=recall,
    average_precision=average_precision,
    estimator_name=name,
    pos_label=pos_label)
display.plot(name=name)
display.ax_.set_title("Test Data")
display.ax_.plot(recall[best_th_ix], precision[best_th_ix], "ro", label=f"f1max (th = {best_thresh:.2f})")
display.ax_.legend()
$\endgroup$

Your Answer

By clicking “Post Your Answer”, you agree to our terms of service and acknowledge you have read our privacy policy.

Not the answer you're looking for? Browse other questions tagged or ask your own question.