3
$\begingroup$

Me and my friend are currently writing our final essay but we are having some problems with our analysis…

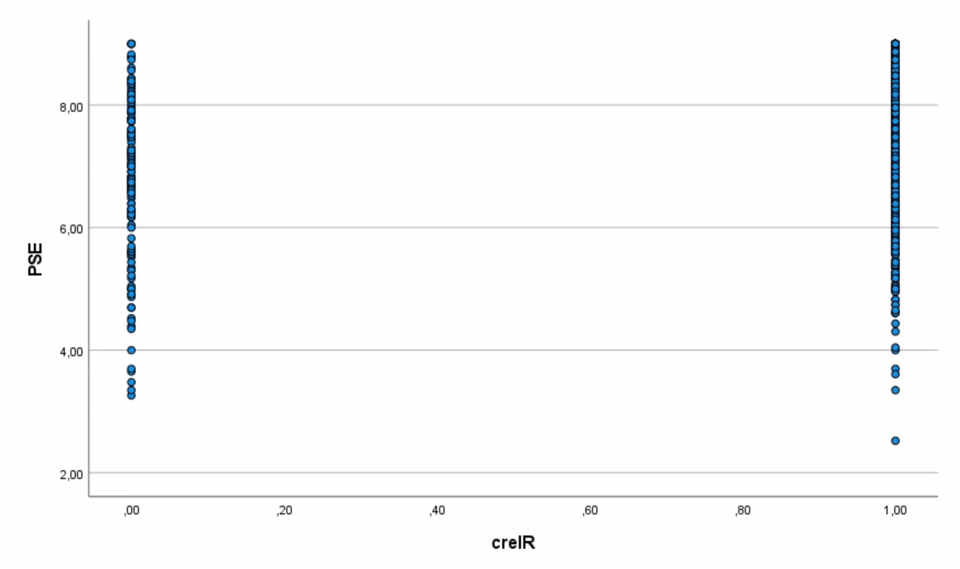
We are doing an hierarchical multiple regression, and we has some categorical predictors (like two-levels variables as biological and non-biological, and some with more levels like grade). Before doing this we controlled for several assumptions, the linearity assumption included. We have some issues with our linearity plots that we do not understand.

Judging from our plots, there is no linear relationship between some of our predictor variables and the dependent variable, although, in our performed regression analysis the variable have a significant association.

How can we understand this? Should we take these predictors out of the regression, or can we still include them? And if we can include them, what is the reasoning for this?

We would be so greatful if someone could help us with this! :)

Here are two picture of two of the scatterplots, as examples: enter image description here
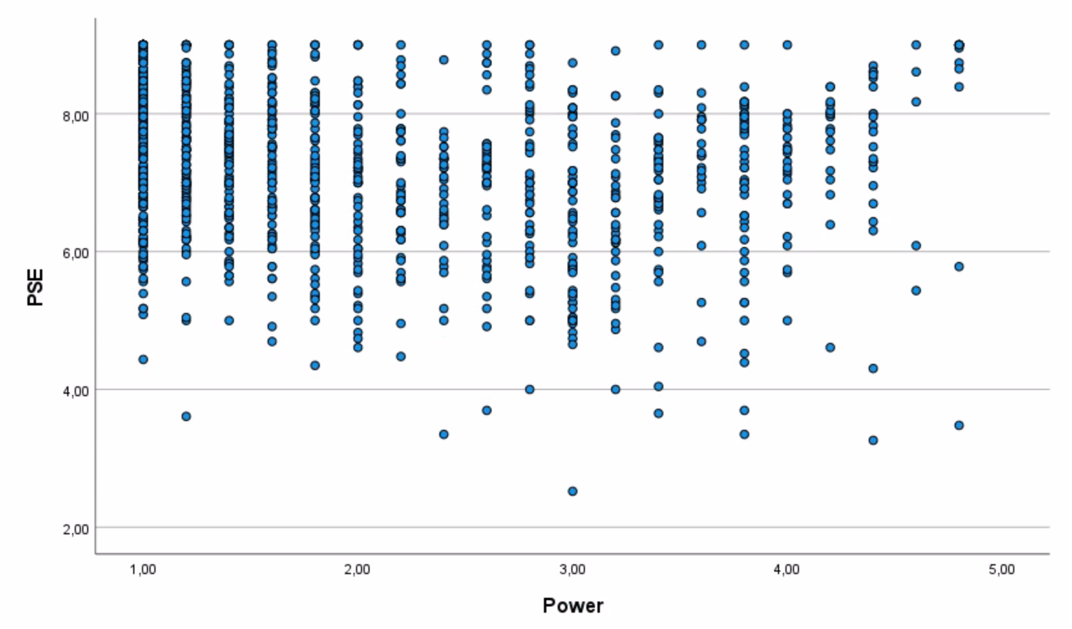
enter image description here

$\endgroup$
3
  • $\begingroup$ Welcome to Cross Validated! How would you expect a linear relationship to look in plots like you gave? $\endgroup$
    – Dave
    Commented Nov 25, 2022 at 14:04
  • $\begingroup$ More linear, like a diagonal stretch i assume. Just so the linearity-assumption that the regression requires is met $\endgroup$
    – Wilma J
    Commented Nov 25, 2022 at 20:23
  • $\begingroup$ Consider providing more information about the data you are analyzing and the questions you are trying to answer, incl. what's PSE, creIR and Power? Also, the first scatterplot suggests the relationship between Power and PSE may be non-linear (this could be addressed by transforming Power). In the second scatterplot there is a lot of overplotting; it may be more instructive to look at the average PSE for the two levels of creIR. $\endgroup$
    – dipetkov
    Commented Dec 2, 2022 at 23:29

1 Answer 1

8
$\begingroup$

The "linearity" assumption (more properly, "correct functional specification" assumption) states that the means of the conditional distributions of Y|X all fall on the function you specify.

A flat line is still a line, so lack of relationship does not imply violation of linearity.

Also, linearity is automatically satisfied for a two-level (binary) X, since the linear model imposes no restrictions on the mean function (a line always passes perfectly through two points having x separation).

Similarly, full dummy variable representations of categorical predictors also imply no restrictions, so linearity is automatically true there as well, as long as there is no other X in the model.

However, with multiple categorical predictors, all modeled with full dummy sets, there will be restrictions unless a saturated model having all possible interactions is modeled. Thus, violation of linearity refers to presence of interaction in this case.

$\endgroup$
2
  • $\begingroup$ Okay, Thank you for your answer! So if we have horizontal lines when plotting IV and DV, we can still put the IV in the regression analysis? :) $\endgroup$
    – Wilma J
    Commented Nov 26, 2022 at 8:02
  • $\begingroup$ First, you need a partial regression plot to detect effects visually. Second, there is no violation of assumption by including a weak predictor, but you might want to exclude them for reasons of parsimony and accuracy of the estimated model. Including weak predictors adds noise to the predictions that is caused by variability in the estimated parameters. $\endgroup$ Commented Nov 26, 2022 at 13:31

Your Answer

By clicking “Post Your Answer”, you agree to our terms of service and acknowledge you have read our privacy policy.

Not the answer you're looking for? Browse other questions tagged or ask your own question.