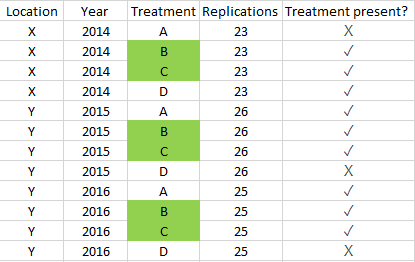
I’m looking for the best way to analyze a data set. The experiment was conducted at two different locations, X and Y. The experiment at location X was conducted in one year (2014), whereas the one conducted at location Y was repeated in the next year too (total two years – 2015 & 2016). There were a total of four treatments in this study A, B, C, D. Similar treatments (A, B, C) were compared at location Y. Location X did not have treatment A, but had an additional treatment D.
In summary, only treatments B, C were common at both locations. Similar treatments were compared at location Y, and treatment D was only tested at location X.
What’s the best way to analyze this data?
Should data be analyzed separately for each location? For location X, this is better because I can compare treatments B, C and D at location X without introducing any bias, as treatment D was not tested at location Y, so I will have the same number of data points to compare to compare treatments B, C and D. This is also better for location Y because similar treatments were compared and the experiment was repeated in the next year too. I will also be comparing similar number of data points for each treatment if data was analyzed separately at each location.
Since treatments B & C were common at both locations, data should not be analyzed separately at both locations because I will get more data points to compare treatments B & C. The problem is that I will get uneven treatment number distribution in this case because treatment D was only tested at location X, so treatment D has only 23 data points, treatments B & C has 74 (23+25+26) data points, and treatment A has 51 (26 + 25) data points
I'm more inclined towards method 1 but looking for an expert opinion for confirmation. Thanks
Some details about my experiment. I put out plants in the field for a week to treat them with above four treatment, took them back to a controlled environment to count the number of infected leaves and DISCARDED them. I repeated the experiment with fresh plants in the next week. This is not a time series data. Treatments were applied for a week at both locations, so the duration of each treatment was the same. This is a positive count data. Plot size, treatment duration and sample material were identical. The only problem is uneven treatment distribution between 2014 & 2015-2016

