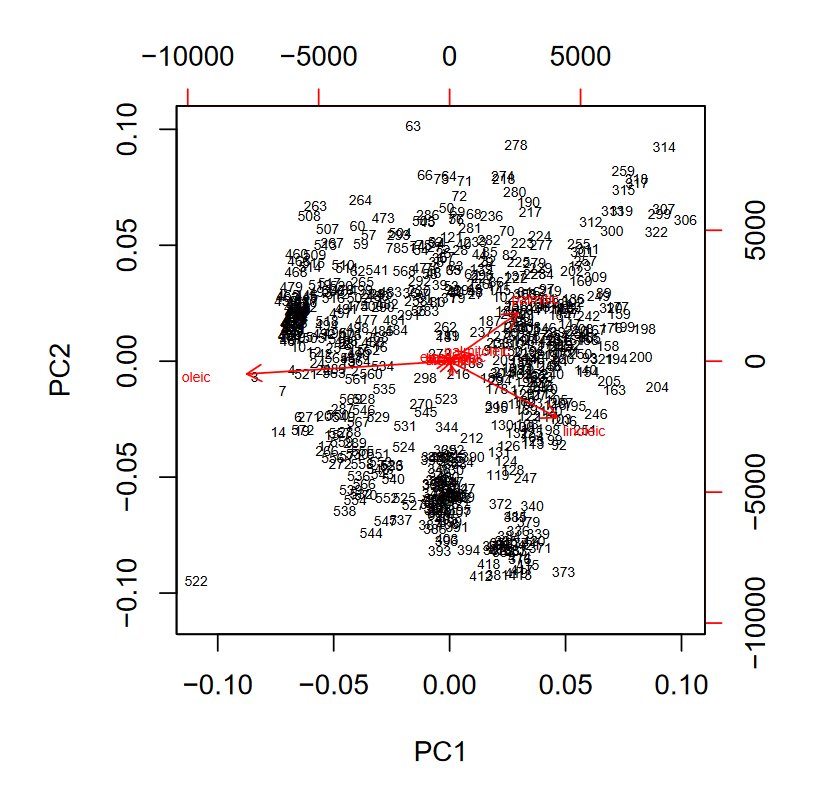
I've recently started an introductory machine learning course and the first topic we have covered is prinicpal component analysis (PCA) and overall I am finding the whole topic quite tricky to wrap my head around. I understand that the goal is to reduce the dimensionality of the data, but how we interpret results has me very confused. I will illustrate my confusion with an example and hopefully someone can explain it to me.
The biplot above is a result of the PCA I have carried out on some data about olive-oil. By looking at the PC loadings I am satisfied that using two principal components is justified (over 95% of the variability is accounted for). What exactly do these red lines indicate? What does it mean if a red line points in a particular direction? As mentioned previously, I have been told that we have carried out this PCA to reduce the dimensionality of the data, but what conclusions does this graph even suggest?
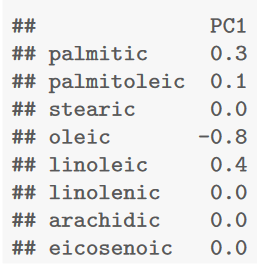
Here's the first PC loading (first principal component), I can see that the most important variables here are 'oleic', 'palmitic' and 'linoleic. What interpretation can we give to these.
I have tried to research this problem myself, but it feels like a lot of online resources don't really give a good idea of what our conclusion should be. So I ask, what can we take away from this PCA?
EDIT: The questions this post has been deemed to be 'too similar to' really aren't helping my understanding. I am coming from a place of not understanding how one interprets these at all, whereas the other posts seem to at least have some understanding. I could do with an explanation that is simple and less reliant on the mathematical side of things, and more explains things from an intuitive perspective.


