9
$\begingroup$

I am approaching PCA analysis for the first time, and have difficulties on interpreting the results. This is my biplot (produced by Matlab's functions pca and biplot, red dots are PC scores, blue lines correspond to eigenvectors; data were not standardized; first two PCs account for the ~98% of the total variance of my original dataset): enter image description here
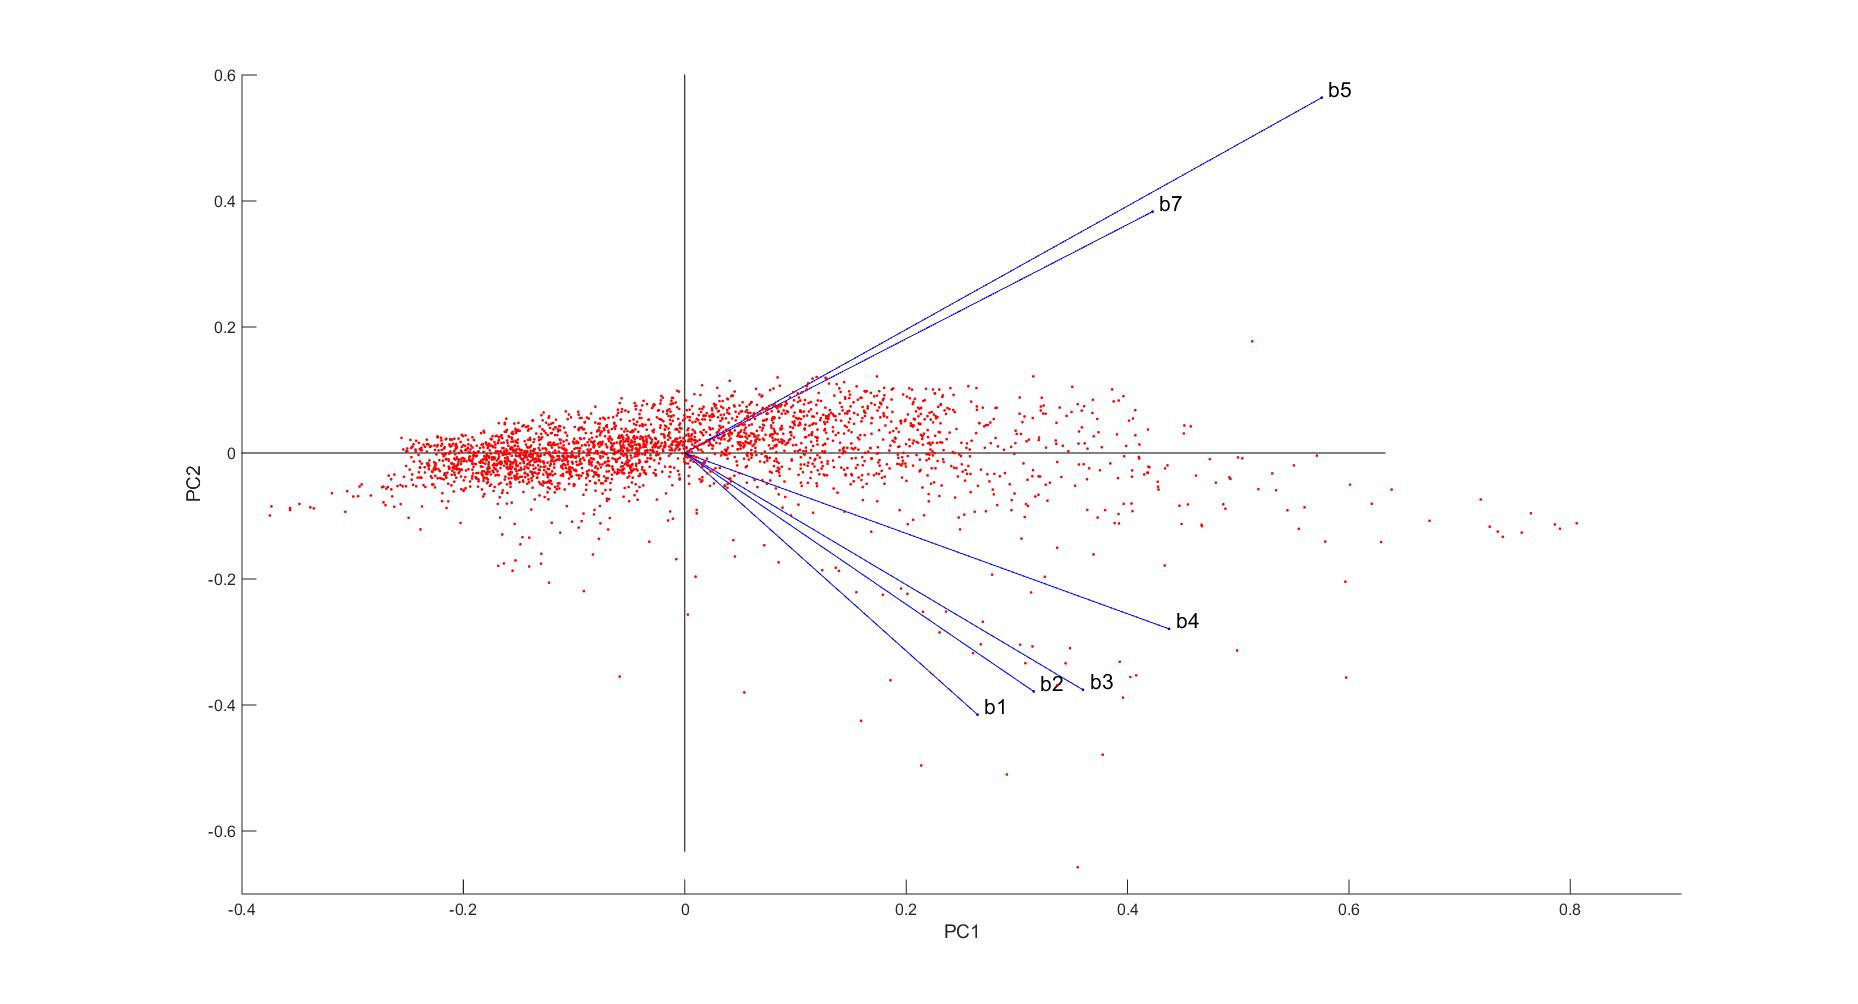
My personal interpretation is that (if I get it right) all variables (b1 to b7) have positive values in the PC1 axis, while b5 and b7 are positive in PC2's and b1 to b4 are negative.

Since all the variables are positive in PC1, those which constrain the system the most are b5 and (then) b7 and b4 (in PC1 axis).

In PC2 axis, the two set of variables have opposite effects on the system (up to me guessing what's the intrinsic meaning of it).

Talking about the scores, they are well clustered, thus I think they all respond to the system quite uniformly, except some outsiders.

My problems:

  1. Is there a connection between the blue vectors direction and the position of the scores? Meaning, do variable vectors which end close to some scores have something to do with those same scores?
  2. If data are well clustered, how do I interpret the results of the PCA in terms of what variable has a major (or minor) influence on the system?
$\endgroup$
2

1 Answer 1

4
$\begingroup$

Your interpretation is mostly correct. The first PC accounts for most of the variance, and the first eigenvector (principal axis) has all positive coordinates. It probably means that all variables are positively correlated between each other, and the first PC represents this "common factor". The second PC (looks like it has much smaller variance) contrasts b5 and b7 from everything else.

Is there a connection between the blue vectors direction and the position of the scores? Meaning, do variable vectors which end close to some scores have something to do with those same scores?

Here is one way to look at it. Imagine that you had a data point with original coordinates $(1,0,0,\ldots)$, i.e. only one variable is equal to $1$ and others to zero. Then this imaginary data point would have PC scores as the end-point of your b1 vector. The same goes for other vectors as well.

Having said that, as the original 6D space is projected on 2D, many different points can be projected to the same 2D point, so if one blue vector, e.g. b1 has an end-point near one particular red point, it does not necessarily mean that this data point had coordinates $(1,0,0,\ldots)$.

I should add that the above is true only for this particular normalization of a biplot, when blue lines correspond to eigenvectors, and the PC scores are not standardized.

If data are well clustered, how do I interpret the results of the PCA in terms of what variable has a major (or minor) influence on the system?

I don't really understand this question. I would not call these data "well clustered", it rather looks like a unimodal distribution. And all variables seem to be pretty similar in your case, positively correlated between each other and contributing similarly to PC1/PC2.

$\endgroup$

Your Answer

By clicking “Post Your Answer”, you agree to our terms of service and acknowledge you have read our privacy policy.

Not the answer you're looking for? Browse other questions tagged or ask your own question.