1
$\begingroup$

I'm working on an academic project. The aim is to forecast some cointegrated time series.

I retrieved the data from 2008 to 2018 of the observations of 30 time series.

I performed a unit-root test to each of them and 16 of them are integrated of order 1.

Then I performed a Johansen test to this multiple time series and found that there exist some cointegration vectors.

Then I estimated a VECM model in order to forecast future values of these time series.

I performed all the test both in Python and R studio and the result are quite identical. The estimates of the VECM model are the same.

To validate the VECM model I performed a normality test on the residuals and I got a high p-value, so the residuals, probably, follows a normal distribution.

So, unless I'm forgetting something, I think that these time series are cointegrated.

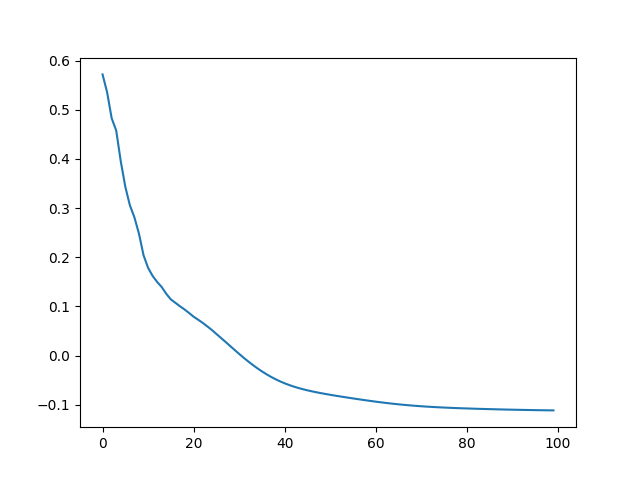
My doubts are about the forecasts. When I predict the future values ( that are identical both in python and R) of each single time series, after some initial adjustments, the future observations "will have an asymptote". Maybe a image will explain better what I'm tryng to write: First Time Series Second Time Series
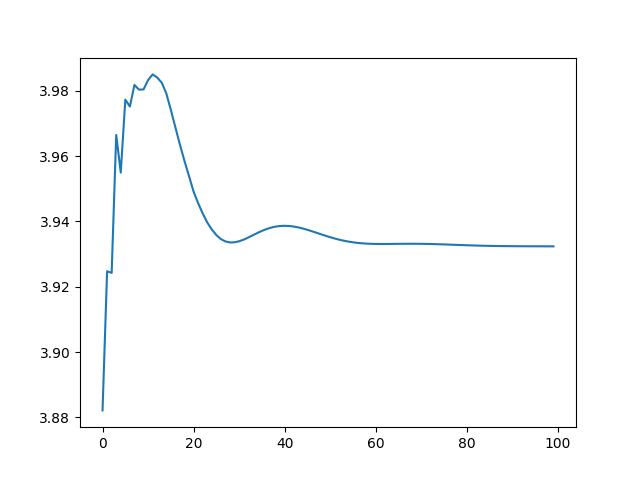
These two are the plots of the 100 future observations of the first and the second time series. All the others have a similar asymptotic behaviour.

Why is this happening? Am I missing something?

When I print the array of the values of the future predictions, after like 100 steps ahead, the predictions will even be constant. I'm guessing that maybe this has something to do with how Python and R manage the unobservable error term of the VECM model, but I'm only guessing.

Do you think that I'm doing something wrong or that I'm not understanding something?

$\endgroup$

1 Answer 1

1
$\begingroup$

This looks fairly normal. If your series do not have deterministic trends or seasonality, the forecasts will converge to constants. Consider a very simple example: \begin{aligned} x_t &= x_{t-1}+u_t \\ y_t &= \beta x_{t-1}+v_t \end{aligned} with $u_t$ and $v_t$ being i.i.d. zero-mean terms. $(x_t,y_t)$ is clearly cointegrated. Both series are I(1), as $x_t$ is a random walk and $y_t$ differs from it just by scaling $\beta$ and an i.i.d. noise term. The linear combination $x_t$ $y_t-\beta x_t=v_t-\beta u_t$ is i.i.d. and thus I(0).

Under square loss, what is the optimal $h$-step-ahead point forecast of $(x_{t+h},y_{t+h})$? It is $(\hat x_{t+h|t},\hat y_{t+h|t})=(x_{t},\beta x_{t})$. If $u_t$ and $v_t$ were stationary zero-mean processes (e.g. ARMA) rather than i.i.d. ones, their optimal point forecasts would converge to zero as $h\rightarrow\infty$. Thus the optimal point forecast of $(x_{t+h},y_{t+h})$ converges to the same $(x_{t},\beta x_{t})$ as $h\rightarrow\infty$. Your case seems to be an instance of that.

$\endgroup$
2
  • $\begingroup$ OK, it's clear, and this is because the optimal one-step-ahead ( the one with minimum MSE ) is the conditional expected value, and then the future ones are obtained recursively, right?Consequently the error term "does not influence" the forecasts because it is zero-mean. Thanks. $\endgroup$
    – andreat
    Commented Feb 20, 2023 at 21:24
  • $\begingroup$ @andreat, roughly so. (The error term "does not influence" the forecasts as long as its conditional mean is zero.) $\endgroup$ Commented Feb 21, 2023 at 7:30

Your Answer

By clicking “Post Your Answer”, you agree to our terms of service and acknowledge you have read our privacy policy.

Not the answer you're looking for? Browse other questions tagged or ask your own question.