12
$\begingroup$

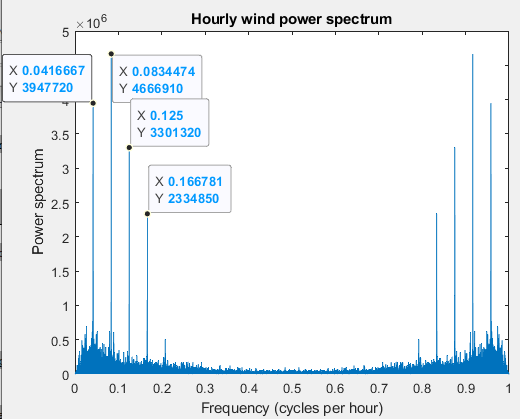
I have taken hourly-based wind power data, by taking its periodogram after making it stationary in R. It gives me four seasonal patterns at periods of 24, 12, 08, and 06, as shown in the figure below.

Is it possible to have sub-hourly seasonality in my wind power data?

The data is given as follows:

enter image description here

$\endgroup$
3
  • 3
    $\begingroup$ You probably mean "sub-daily", not "sub-hourly" seasonality. $\endgroup$ Commented Mar 13, 2023 at 7:10
  • 4
    $\begingroup$ "after making it stationary in R" Could you elaborate on this. $\endgroup$ Commented Mar 13, 2023 at 7:33
  • $\begingroup$ when I take ndiffs() of the data, it shows me to take non-seasonal differencing (stationarity). i read it in this post, stats.stackexchange.com/questions/16117/… $\endgroup$
    – Mastoi
    Commented Mar 15, 2023 at 2:20

3 Answers 3

13
$\begingroup$

Many things are possible. (Here is one possible data-generating process that might lead to such sub-daily seasonalities, but no, I'm not really serious about that.)

I am not an expert in wind power generation as such, however, I find such a periodicity extremely unlikely. I understand that wind could have intra-daily patterns (differences between night and day), i.e., a seasonal period of 24 hours, and intra-yearly patterns (differences between summer and winter), i.e., a seasonal period of about 8766 hours. (These are examples of - you may find the tag wiki helpful.)

However, other patterns simply don't make a lot of sense from a data generation point of view. Yes, the moon might have some very weak effect on the wind, perhaps via tides, so we might have intra-monthly patterns. I see no reason why the wind itself should have intra-weekly effects. Conversely, wind power generation might actually have such patterns: since electricity demand has weekly patterns, it might be that wind farms get cycled up or down with a certain weekly influence. But subdaily patterns at all these periodicities sound like an artifact or an error to me.

I have to admit that I am a forecaster and think like one. To a forecaster, the question is not so much whether a structure is present in a time series, but whether it helps us forecast the series better. As such, I naturally turn to papers about forecasting wind power, e.g., something connected with a good journal like the International Journal of Forecasting, and then I start skimming them on whether they report this kind of seasonality. Here is a paper that sampled in 10-minute buckets and found daily seasonality ($24\times 6 = 144$) periods per cycle - nothing about the kinds of seasonality you found. The GEFCom2014 did include a competition on wind power forecasting, but the summary paper does not go into details on what seasonalities were modeled by the winning methods. You might be able to get a better idea of what other people have found with a deeper literature search.

$\endgroup$
7
  • $\begingroup$ The apt xkcd reference and the precious statement: To a forecaster, the question is not so much whether a structure is present in a time series, but whether it helps us forecast the series better. Thank you. $+1.$ $\endgroup$ Commented Mar 13, 2023 at 7:52
  • 2
    $\begingroup$ @User1865345: I like to say that the proof of the pudding is in the eating, and the proof of the model is in the prediction or forecast. I would not assume everyone here to agree. $\endgroup$ Commented Mar 13, 2023 at 7:59
  • 2
    $\begingroup$ If this is in a coastal area, patterns during the day (initially the water is warmer, then the land warms up faster etc. changing the wind patterns - vs. night where things cool down) are certainly a known thing and might be in ~ 6 to 8 hour periods. Would not hold in all locations (on average, I guess this gets water down). $\endgroup$
    – Björn
    Commented Mar 13, 2023 at 11:57
  • 2
    $\begingroup$ @Björn: I would expect effects like that to lead to intra-daily patterns. but not subdaily ones with two or more cycles per day. But then, I'm not an expert in coastal wind dynamics... $\endgroup$ Commented Mar 13, 2023 at 12:03
  • 1
    $\begingroup$ As well as any small daily and annual pattern, you may also need to consider the much larger impact of very short-term autocorrealtion (if it is very windy now then it is likely to be windy in an hour's time) - it is surprising that the $0.041667$ uptick is not the highest. The whole shape of the chart looks strange, and I almost wonder if it is a mix of data collected with different time intervals. $\endgroup$
    – Henry
    Commented Mar 14, 2023 at 23:45
24
$\begingroup$

TLDR; The signal period is $24$ hours, eventhough you have your power spectrum indicating components with a smaller period. The components with period $6, 8, 12$ hrs also repeat themselves every $4 \times 6 = 24, 3 \times 8 =24, 2 \times 12 =24 $ hrs. So they all have, in a way, a common period of 24 hrs.


It gives me four seasonal patterns at periods of 24, 12, 08, and 06

This sounds like you get overtones. If your periodogram is a sort of Fourier spectrum, then this is not weird. It means that the daily pattern consists of more structure than just a single sine wave.

This doesn't mean that the period of the signal is smaller than 1 day. Below is an example signal constructed with several overtones (wave lengths smaller than 1 day), and you can see that the period of the signal is 1 day. The higher frequency signals influence the shape but not the period of the signal.
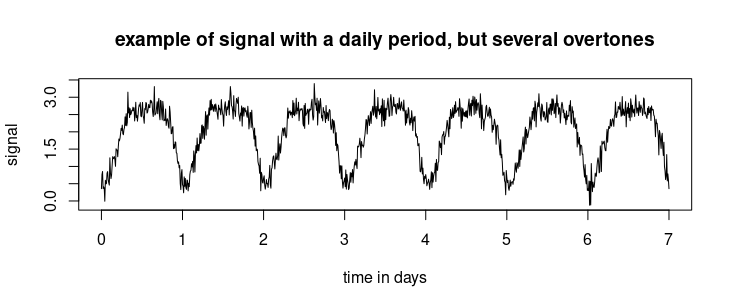
example of signal with period 1 day but many higher frequency components

The period of a function that is a sum of periodic functions is the least common multiple of the periods of the functions in the sum.

### t is time for one week of data sampled every ten minutes
t = seq(0,7*24*60,10)

### some example measurement of data that depends on sin waves with multiple sub-daily periods
Td = (24*60)/(2*pi)  ### daily period
y = 2 + sin((t+1000)/(Td)) + 0.4* sin((t+1200)/(Td/2)) + 0.1* sin((t+800)/(Td/3)) + 0.1* sin((t+1000)/(Td/4)) 
                  
### plot
plot(t/24/60,y+rnorm(7*24*6,0,0.2),
     type = "l", xlab = "time in days", ylab = "signal",
     main = "example of signal with a daily period, but several overtones")
$\endgroup$
1
  • $\begingroup$ Sir thank you for your kind response, I want to check the number of seasonal patterns in my wind data, but when I take built-in mstl() function in R, it asks me to provide the frequencies at which these seasonal patterns occur. these frequencies I don't know. when I take acf plots and pacf plots to see seasonal patterns then it gives me the spikes at an integer multiple of 24 periods and above and below of this period. which is more confusing for me. that's why i tried periodogram of my wind data and I got more confused. $\endgroup$
    – Mastoi
    Commented Mar 15, 2023 at 2:33
18
$\begingroup$

This suggests a daily periodic signal with harmonics

When looking at time-series data in the frequency domain, it is common for periodic signals in the data to consist of a main frequency and then a set of harmonics. The harmonic frequencies are integer multiples of the main frequency of the signal. This occurs because each of the spikes in the frequency domain correspond to a sinusoidal wave in the time domain, and the actual periodic signal in the time domain is often not a perfect sinusoidal wave. Thus, what you have here sugggests that your wind power data has a periodic daily signal that is not a perfect sinusoidal wave (but which can be created as a weighted sum of a main sinusoidal wave and then four harmonics that are smaller sinusoidal waves at the harmonic frequencies).

$\endgroup$
1
  • $\begingroup$ sir thank you for your response, what I am looking for by taking the periodogram of my wind data is to find out the exact number of seasonal patterns (seasonality). which can be found by taking the mstl() function in R, but the problem with mstl() in R is to tell frequencies, which I don't know. $\endgroup$
    – Mastoi
    Commented Mar 15, 2023 at 3:07

Your Answer

By clicking “Post Your Answer”, you agree to our terms of service and acknowledge you have read our privacy policy.

Not the answer you're looking for? Browse other questions tagged or ask your own question.