4
$\begingroup$

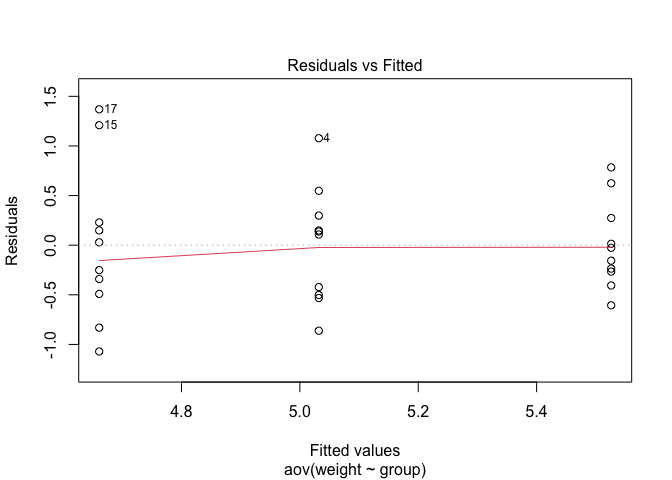
I am studying this source about One-Way ANOVA Test in R. We know that ANOVA test assumes that the data is normally distributed and the variance across groups are homogeneous. In the source the claim that we can check this with some diagnostic plots. At the part Check the homogeneity of variance assumption, the say that the residuals versus fits plots can be used to check the homogeneity of variances:

The residuals versus fits plot can be used to check the homogeneity of variances.

In the plot below, there is no evident relationships between residuals and fitted values (the mean of each groups), which is good. So, we can assume the homogeneity of variances.

But it is not explained how we can see it from the plot. Is it because of distribution of the points or of because the red line? So here is some reproducible code with the plot they are talking about:

library(ggpubr)
#> Loading required package: ggplot2
my_data <- PlantGrowth
my_data$group <- ordered(my_data$group,
                         levels = c("ctrl", "trt1", "trt2"))
# Compute the analysis of variance
res.aov <- aov(weight ~ group, data = my_data)
# Summary of the analysis
summary(res.aov)
#>             Df Sum Sq Mean Sq F value Pr(>F)  
#> group        2  3.766  1.8832   4.846 0.0159 *
#> Residuals   27 10.492  0.3886                 
#> ---
#> Signif. codes:  0 '***' 0.001 '**' 0.01 '*' 0.05 '.' 0.1 ' ' 1
# 1. Homogeneity of variances
plot(res.aov, 1)
Created on 2023-04-07 with reprex v2.0.2

So I was wondering if anyone could please explain how to interpret this plot and why this could tell us something about the homogeneity of variance assumption?

$\endgroup$
0

3 Answers 3

8
$\begingroup$

It's a good question, because in practice a great deal depends on experience rather than exact rules, and how is one to judge with little or no experience, and who counts as experienced or expert, and will experts always agree? (They won't.)

Even more depends on knowing that equal variances are an ideal condition, not a binding essential such that tiny deviations are fatal. It's a hobby-horse of mine, although not an original point, that the almost universal use of the term assumption in these statistical contexts is not especially helpful. In logic and pure mathematics, a failure of assumptions can be utterly fatal to the validity of an argument. In applied mathematics, including statistics, a failure of "assumptions" has to be judged pragmatically, because just about every application is an approximation. We would often be better off talking about ideal conditions, a phrase intended to march with a realisation that real data are usually messy and imperfect, especially when compared with fantasy or brand-name distributions. (Ironically, or otherwise, one of the most important ideal conditions, independence in some sense, is rarely discussed or checked for.)

There are some slightly more precise guidelines that I would add.

  1. As a starting point, unequal variances that need attention tend to leap out at you from a plot, sometimes phrased in terms of a pattern hitting you between the eyes. If you're in doubt, you can usually assume there isn't a real problem.

  2. Perhaps contradicting #1, but that's typical of any advice: you can't always trust a graph. An appearance of greater or lesser variability can sometimes arise from differences in group size. A large group is more likely to include values from the tails of a conditional distribution than a small group. Hence if in doubt, calculate the variances to check, either for pre-defined groups as here or in some other appropriate manner.

  3. Is there a better model within reach? is the important associated question. For example, if variability of residuals seemed to increase with fitted or predicted values, I might wonder about working on a transformed scale, say by taking logarithms or (even better) using a generalized linear model with a logarithmic link. You stick with a model if you can't think of a better one, or more positively, change to a better model if you can see one. (Trying another model and finding that it isn't better, indeed possibly worse, and being able to report that, is very good practice in my view. Some people get queasy about choosing a model after exploration of the data or initial analysis. The view that you must think up a model in advance rather limits the scope for learning from data. Where did the model come from any way?)

  4. Your data are unlikely to be absolutely unique or unprecedented. What do people do in your journal literature? More generally, what do you know, as a scientist or other subject-matter expert, about how big or how small values may be, including whether there are limits to counted or measured values?

  5. More work, but not much so with decent software, is to simulate with similar sample sizes from a set-up with homoscedastic errors and see how different do results look in a portfolio of fake datasets? People new to statistics often underestimate how much variability there is in small samples, even if the underlying process is close to ideal. This example qualifies as a very small dataset by most standards.

$\endgroup$
0
6
$\begingroup$

The answer by @NickCox is excellent. I add that the shown plot on its own in my view doesn't raise any concern, as any difference in variances is not strikingly clear and one could imagine changing just 1-3 observations here by a bit (extreme outliers should make you worry) so that variances would look about as homogeneous as it gets, i.e., one could easily imagine this to be generated from a model with homogeneous variances with a bit of random variation.

$\endgroup$
6
$\begingroup$

I agree that @NickCox's answer is an excellent answer to the general question: "how do I use graphical summaries to evaluate the degree to which my data violate the modeling assumptions I am using?"

However, I would quibble with a couple of the more specific assertions in the source material.

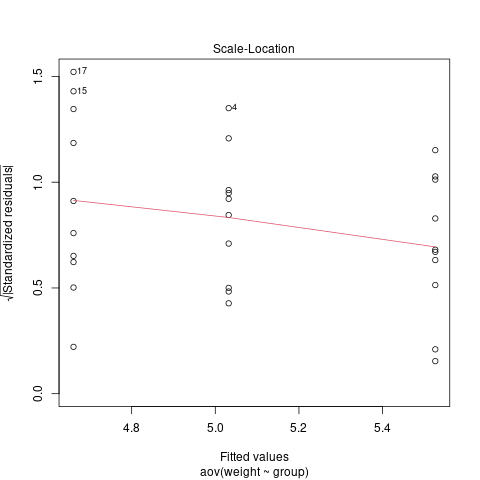
1. scale-location plots are (much!) better than residual vs. fitted plots for assessing heteroscedasticity

Here's what we get when we ask for plot(res.aov, which = 3) (see ?plot.lm for more details):

scale-location plot

This shows the square root of the absolute value of the standardized residuals vs. the fitted values. The red line gives a reasonable visual indication of the trend in the variability (i.e., in this case the variance decreases slightly as the fitted values increase).

  • the most important aspect of the S-L plot is its use of the absolute value, which allows you to judge trend in the data rather than the degree of variation (which is harder to judge by eye, and in particular can be misleading if the fitted values are unevenly distributed; this is the same idea as @NickCox's point #2).
  • the scale-location plot uses standardized residuals ($(\hat y - y)/(\sigma \sqrt{1-h})$, where $h$ is the diagonal of the hat matrix), which correct the residuals so that they have equal variances if the data are actually homoscedastic.
  • the square-root is used to reduce the skewness of the distribution of the transformed residuals: from ?plot.lm,

$\sqrt{|E|}$ is much less skewed than $|E|$ for Gaussian zero-mean $E$

2. the numbered points are "outliers" only in the loosest sense

If you look at ?plot.lm you'll see that there is an argument id.n = 3, corresponding to

id.n: number of points to be labelled in each plot, starting with the most extreme.

In other words, the most extreme three residuals will always be labeled, regardless of whether they would be considered unusually extreme under the model assumptions. (Defining outliers is a messy subject in any case; if you want to find outliers, your simplest/default strategy would be using plot(res.aov) with which equal to 4, or 6, which will show you Cook's distance.)

$\endgroup$
4
  • $\begingroup$ I wonder whether on the basis of this you'd agree with my assessment that there is no reason for concern. I'd still think so (anything that can be seen here is a pretty weak and probably insignificant deviation from homogeneity; even if technically significant I don't think it will hurt standard analysis much), but the plot may look more alarming to some than residuals vs. fitted. $\endgroup$ Commented Apr 8, 2023 at 9:34
  • $\begingroup$ (+1) Thanks for the nod, and here's a reciprocation for invaluable extra commentary On a trivial detail, in what I read it's residual vs fitted, not fitted vs residual, so that one mentions first what is on the y axis. But there is a small chorus of well-informed people who jump the other way. stats.stackexchange.com/questions/146533/… gives more discussion for language mavens, but should be ignored by others. $\endgroup$
    – Nick Cox
    Commented Apr 8, 2023 at 9:54
  • $\begingroup$ On the key points: #2 is indisputable but I tend to go with @ChristianHennig on #1. Elsewhere I have used variants of this kind of plot but I think researchers should start with residual vs fitted. $\endgroup$
    – Nick Cox
    Commented Apr 8, 2023 at 9:57
  • 1
    $\begingroup$ I agree that there is not much reason for concern here. I agree that residual vs fitted should be inspected first (bias is more important than heteroscedasticity), but I think even if the S-L plot looks scarier, it's still a better way to see what the pattern is. $\endgroup$
    – Ben Bolker
    Commented Apr 8, 2023 at 14:54

Your Answer

By clicking “Post Your Answer”, you agree to our terms of service and acknowledge you have read our privacy policy.

Not the answer you're looking for? Browse other questions tagged or ask your own question.