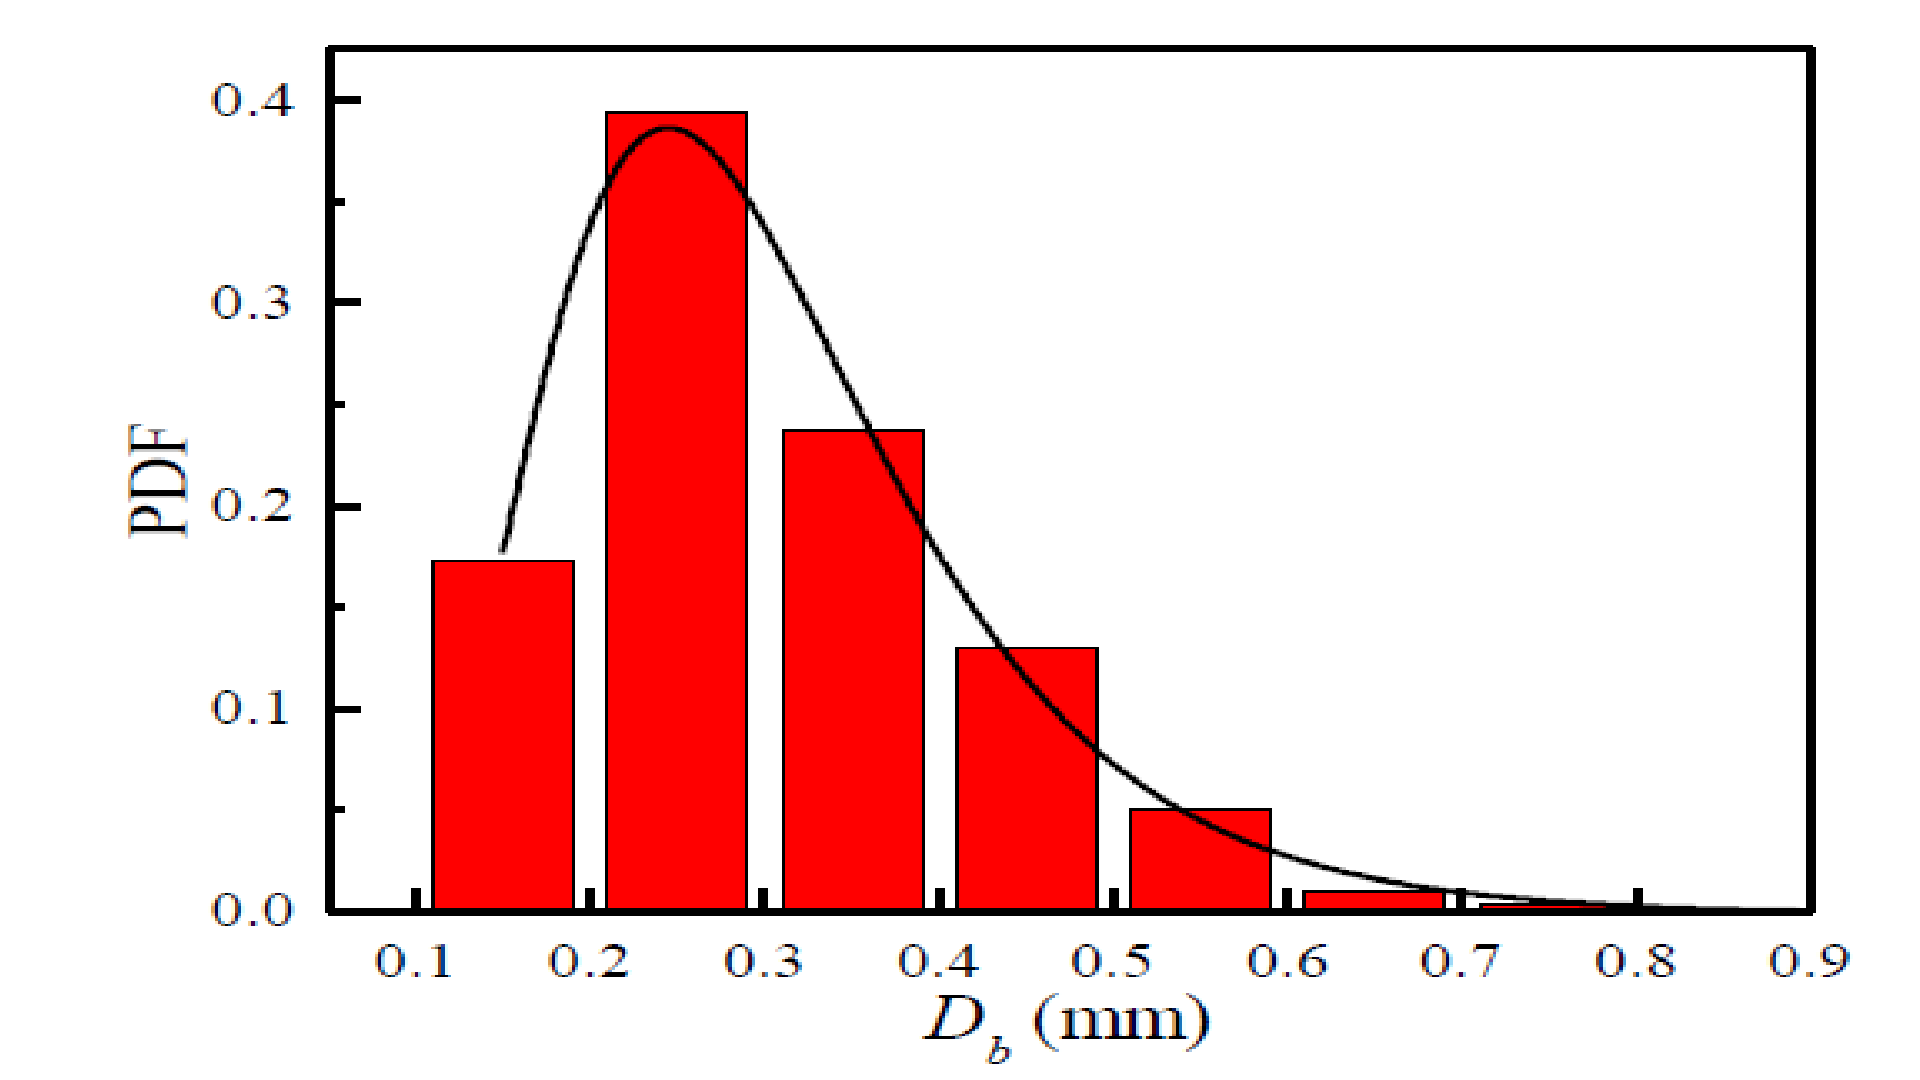
I am having difficulty finding the correct location and scale parameters for a PDF diagram that I need to validate my data.  I have already calculated the location parameter to be -1.01, but I am unsure about the scale parameter.
I would appreciate any guidance or correction you could provide.
I am currently conducting a simulation that involves population balance modeling to analyze particle size distribution. In my research, I have found that most of the reference papers describe the size distribution using a PDF diagram that appears to resemble a log-normal distribution, given its skewed nature to the right.
This diagram is not mine, but it belongs to Huang, 2019 and I am trying to run a simulation in order to obtain the same results as shown in the diagram.
I have previously attempted to adjust the location and scale parameter values that I obtained from the graph, but the results I obtained were always different from the graph. Thank you for the comments.
-
1$\begingroup$ Is it a Gamma distribution that you are fitting on your data? Then there are different parameter estimation methods: en.wikipedia.org/wiki/Gamma_distribution#Parameter_estimation $\endgroup$– Camille GontierCommented Apr 24, 2023 at 13:52
-
$\begingroup$ You have included the lognormal tag, do you know the distribution is lognormal? In general, the plot you provided isn't enough in isolation to tell you anything (parametrically speaking). $\endgroup$– statspleaseCommented Apr 24, 2023 at 14:36
-
$\begingroup$ Did you notice the area under your curve is much smaller than $1$? (After all, the entire area beneath it lies within a rectangle of width less than $1$ and height less than $0.5.$) Thus, it cannot possibly be a correct representation of any PDF. Perhaps you could explain how you obtained this diagram, then, and how it might be related to your data? $\endgroup$– whuber ♦Commented Apr 24, 2023 at 16:14
-
$\begingroup$ The duplicate explains how to estimate lognormal parameters from binned data like these. It will give you excellent estimates for these data, assuming the distribution really is close to lognormal. $\endgroup$– whuber ♦Commented Apr 25, 2023 at 13:35
-
1$\begingroup$ @statsplease I believe it more likely that this is trying to be a bar plot of relative frequencies of binned observations and that the curve was fit to the bar heights. Although the estimates might vary little or not at all depending on the total count, the standard errors of the parameter estimates will depend on the bin counts. $\endgroup$– whuber ♦Commented Apr 26, 2023 at 13:34
1 Answer
First up, just worth pointing out that is a terrible plot. The labelling on the y-axis is completely disingenuous and outright wrong. The smooth density (lognormal apparently) shown is surely some scaled version of the density. We know this because how could the density shown sum to 1 across its support?
The histogram bars seem to represent the probability mass for intervals incrementing by 0.1 from 0 to 1. Nothing is shown for (0, 0.1]* for some reason.
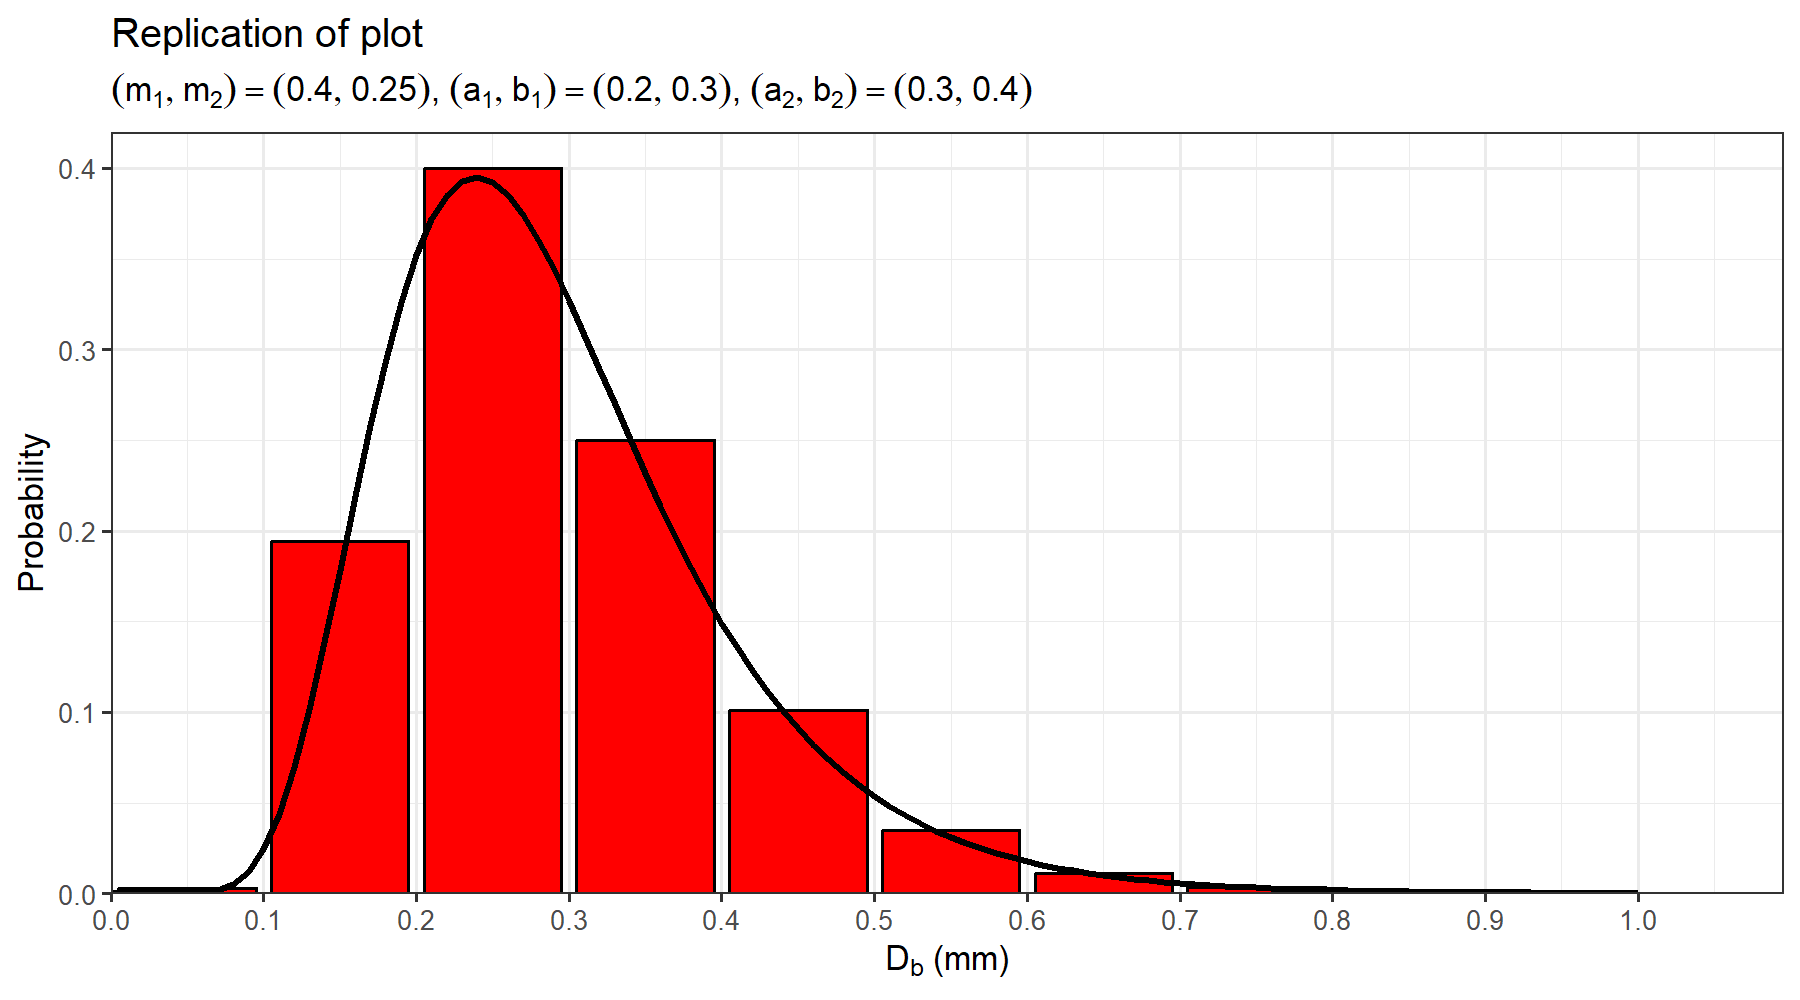
In any case, we can ignore the density and simply utilize the histogram bars to solve for the parameters of the distribution. Take any two bars. Accurately(?) read off the probability masses occurring in those interval. Also note the intervals themselves. If we define the masses as $$(m_{1},m_{2})$$ and the corresponding two intervals as $$(a_{1},b_{1})\quad\text{and}\quad(a_{2},b_{2})$$ and further define $$G(\mu, \sigma;a,b)=F(b;\mu,\sigma)-F(a;\mu,\sigma)$$ where $F(x;\mu, \sigma)$ is the cumulative distribution function of a lognormal distribution.
Your problem reduces to solving the system of equations $$\begin{align} G(\mu, \sigma;a_{1},b_{1})=m_{1}\\ G(\mu, \sigma;a_{2},b_{2})=m_{2} \end{align}$$ for $(\mu, \sigma)$.
In any case, this is what I replicated:
giving $(\mu, \sigma)=(-1.2950867,0.3694235)$. Of course your exact results will depend on the values you read off the plot.
- Or is it [0, 0.1) or (0, 0.1) or [0, 0.1]? Who knows.
-
$\begingroup$ I also suspected that it was not possible to obtain a certain value. I would like to know how to scale down. Could you explain how to do it? $\endgroup$ Commented Apr 25, 2023 at 12:02
-
$\begingroup$ @AgisFitrony Can I ask how you know what distribution (lognormal) it is? Was it specified in the paper? And further how did you determine the location parameter? I saw your edit to the question where you seem to indicate that the lognormal distribution was a guess. There are many right-skewed distributions so observing the shape probably doesn't help much. $\endgroup$ Commented Apr 25, 2023 at 12:17
-
$\begingroup$ Also, you state you already know the location parameter is -1.01. How did you obtain this? I can't seem to find a $\sigma$ that gives the above plot for a $\text{LN}(\mu=-1.01,\sigma)$. $\endgroup$ Commented Apr 25, 2023 at 12:26
-
$\begingroup$ The paper did not specify the distribution. I determined it by extracting the data using WebPlot and performing calculations based on the explanation provided in this website towardsdatascience.com/…. While I did manage to find the scale parameter, the result was different from my reference graph and how can I solve the equations you provided? I am not sure if it is possible to solve them manually. Do I need to use software to solve them? $\endgroup$ Commented Apr 26, 2023 at 5:31
-
$\begingroup$ @AgisFitrony How did you solve for the one parameter (independently from the other parameter) only visually without using software? $\endgroup$ Commented Apr 26, 2023 at 5:45

