1
$\begingroup$

As explained in the title, I would like to transform a yearly dataset into a monthly one, but including a constraint. My current dataset gives the yearly production of a commodity, and from year to year, the production can vary a lot. Let's assume that the yearly production in year X=120, and the yearly production in year X+1=240 If I choose to divide by 12 the total production of year X and X+1 to get the monthly production, there is a gap between December X(=10) and January X+1(=20). I used a Kernel method in order to artificially smooth this gap,and I obtain something like: November X=10, december X=12.5, January X+1=17.5 and February X+1=20 But the problem is that if I sum the production of every month of year X obtained with the Kernel method, it differs from the actual yearly production. The total early production being the only reliable data, it's a problem.

So, to be more specific, my question would rather be the following: is there a statistical method that can "smooth" this kind of dataset, but that can allow for constraint on yearly production?

I apologize if my question is not clear enough. I also apologize to the statistician that may see this post: trying to increase the size of a dataset this way is certainly not a good idea.

I tried a Kernel, but it does not satisfy the yearly production constraint

$\endgroup$
3
  • $\begingroup$ The package tempdisagg might be something to look into. $\endgroup$
    – NicChr
    Commented Jul 29, 2023 at 11:19
  • 2
    $\begingroup$ I voted to migrate this question to crossvalidated, as it is clearly off-topic in SO. However, I fell the question is missing some key information, answerers on CV are likely going to ask for further clarifications $\endgroup$
    – GuedesBF
    Commented Jul 29, 2023 at 11:30
  • $\begingroup$ Do you have any monthly data on related variables? For example, payroll from the factory by month or sales? $\endgroup$
    – dimitriy
    Commented Jul 29, 2023 at 14:53

2 Answers 2

0
$\begingroup$

Don't know if this is exactly what you want. But we can calculate the monthly production by dividing the yearly production by 12 and create the new dates for each month in the format "YYYY-MM-01". Then maybe add a smoothing paramenter interms of having the average between the last observation of December and the first observation of January for each year transition.

# Random exaple data
data <- data.frame(
  year = c(2000,2001,2002,2003,2004,2005),
  production = c(1452,1453,1455,5431,6842,3580)
)


# Initialise some list outside the loop
my_list <- data.frame(
  date = character(),
  production = numeric()
  )


# for loop for dividing everything by 12
for (i in 1:nrow(data)) {
  monthly_production <- data$production[i] / 12
  
  # add date parameters
  for (month in 1:12) {
    year_month <- paste0(data$year[i], "-", sprintf("%02d", month), "-01")
    
    # Add a smoothing step for year transitions
    if (month == 1 && i > 1) {
      last_december_production <- data$production[i - 1] / 12
      smoothed_production <- (last_december_production + monthly_production) / 2
      
      my_list <- rbind(my_list, data.frame(
        date = year_month,
        production = smoothed_production
      ))
    }
    
    my_list <- rbind(my_list, data.frame(
      date = year_month,
      production = monthly_production
    ))
  }
}

print(my_list)
$\endgroup$
0
$\begingroup$

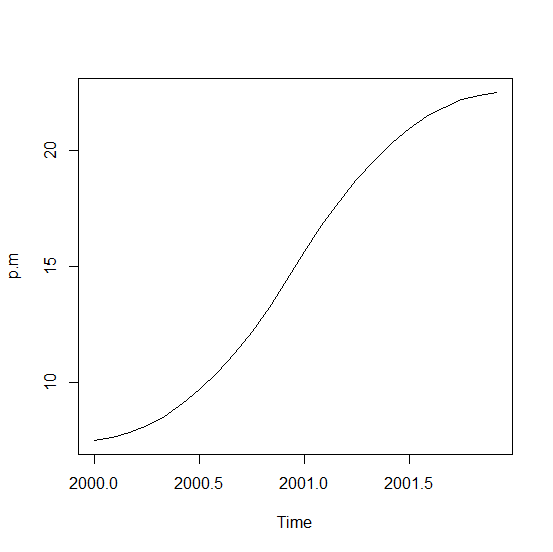
As mentioned in the comments the tempdisagg package in R can be used. The td function there supports a number of disaggregation methods specified via the method= argument. See the package documentation for additional methods and examples. As an example below we define a 2 element annual production series p.ann, for years 2000 and 2001 and then disaggregate it to the td class object fm and use predict to get p.m, the monthly disaggregated production series. We then plot the monthly series and finally using aggregate.ts we recover the annual series.

library(tempdisagg)

p.ann <- ts(c(120, 240), start = 2000)  # annual production

fm <- td(p.ann ~ 1, to = "monthly", method = "denton-cholette")
p.m <- predict(fm)  # monthly production
p.m
##            Jan       Feb       Mar       Apr       May       Jun       Jul
## 2000  7.525952  7.629758  7.837370  8.148789  8.564014  9.083045  9.705882
## 2001 15.622837 16.764706 17.802768 18.737024 19.567474 20.294118 20.916955
##            Aug       Sep       Oct       Nov       Dec
## 2000 10.432526 11.262976 12.197232 13.235294 14.377163
## 2001 21.435986 21.851211 22.162630 22.370242 22.474048

# alternately try:
# library(xts)
# plot(as.xts(p.m))
plot(p.m) # plot shown at end

aggregate(p.m) # recover the original series via summation
## Time Series:
## Start = 2000 
## End = 2001 
## Frequency = 1 
## [1] 120 240

screenshot

$\endgroup$

Your Answer

By clicking “Post Your Answer”, you agree to our terms of service and acknowledge you have read our privacy policy.

Not the answer you're looking for? Browse other questions tagged or ask your own question.