I am doing some stuff with the SciPy's levy_stable distribution. The documentation says:
levy_stable.pdf(x, alpha, beta, loc, scale)is identically equivalent tolevy_stable.pdf(y, alpha, beta) / scalewithy = (x - loc) / scale.
Then, I understand that
levy_stable.pdf(x, alpha=1, beta=1, loc=0, scale=10)
should be a stretched-around-0 but not displaced version of
levy_stable.pdf(x, alpha=1, beta=1, loc=0, scale=1)
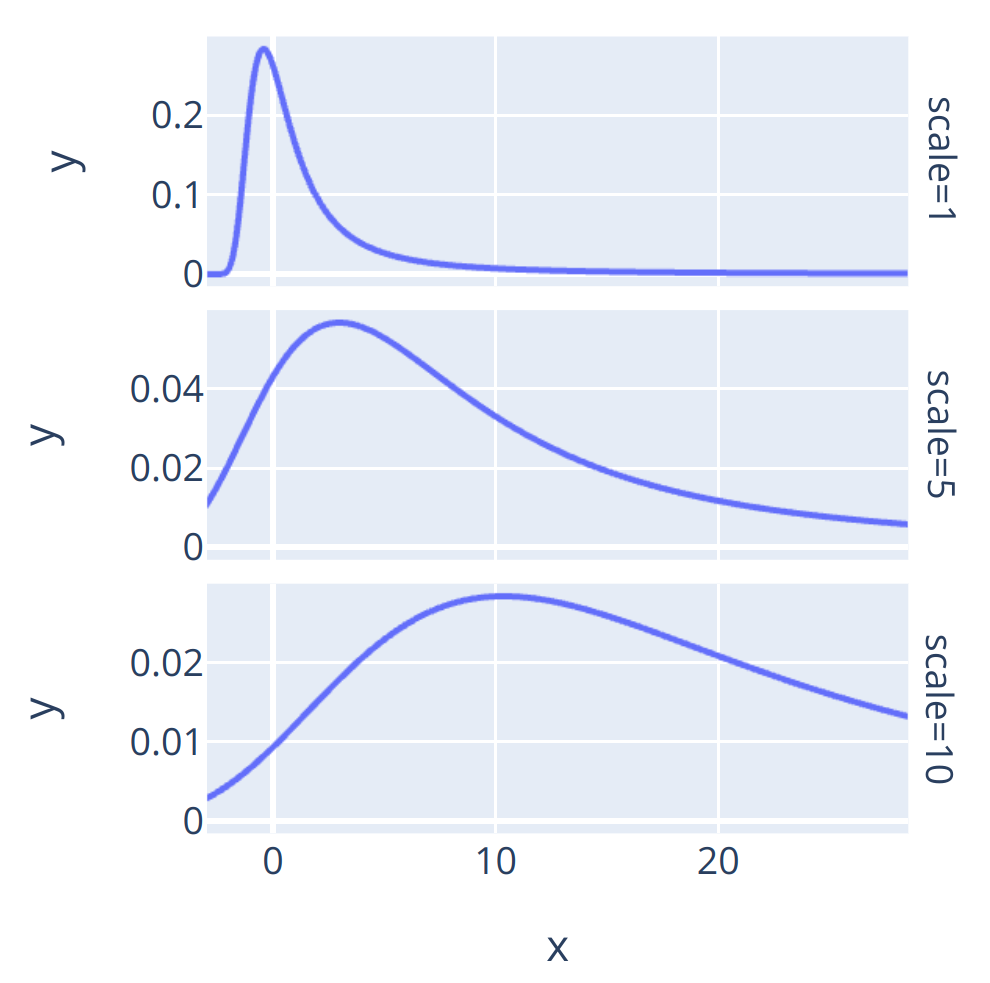
However, I am getting this:
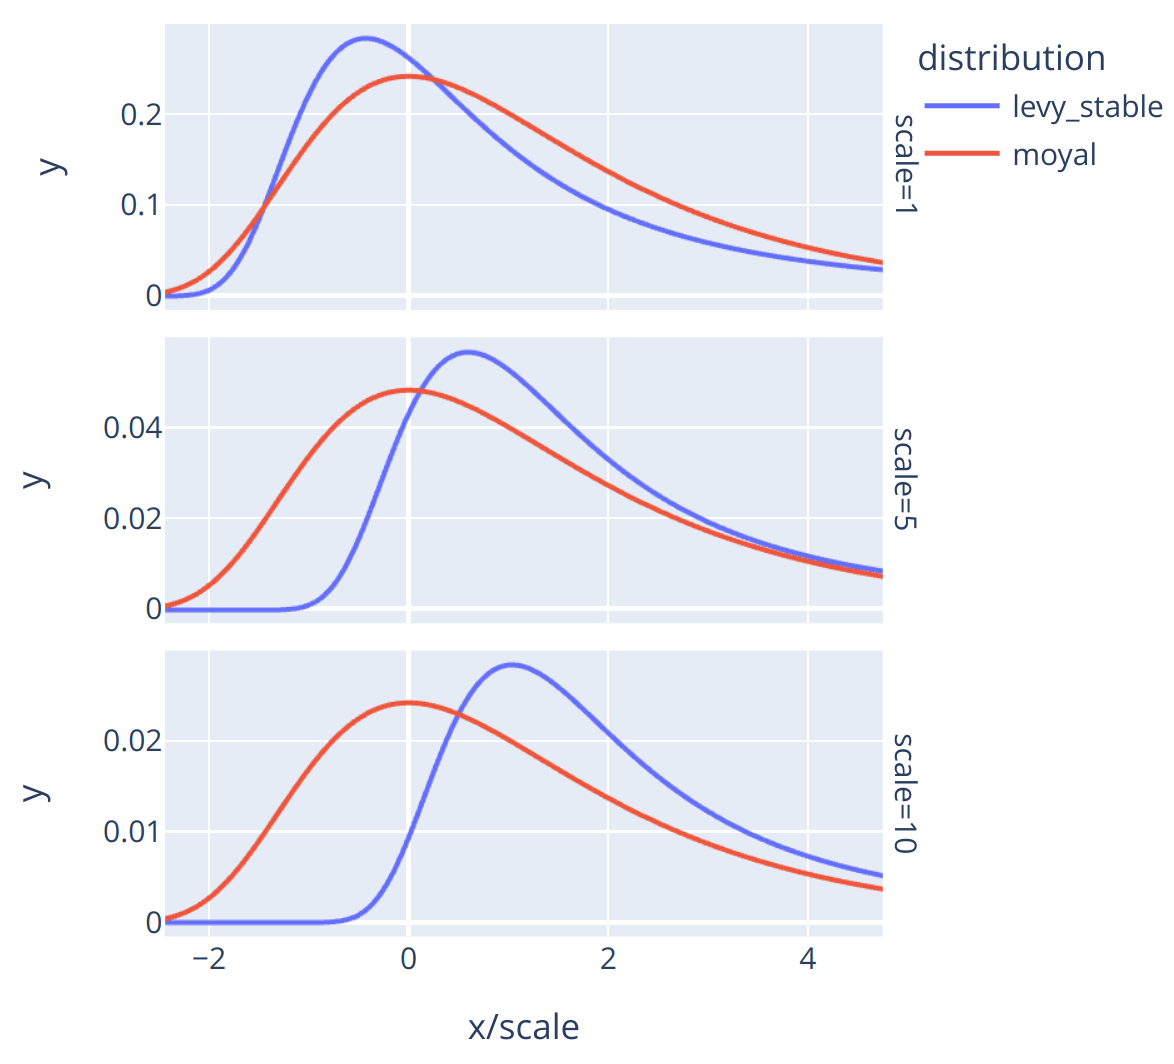
Note how the maximum is at a negative value when scale=1 but at a positive value when scale>=5, which means that it has been displaced. Why? Bug or am I missing something? In other easier distributions, such as norm, the loc and scale parameters do exactly what you expect given their names: Translate and stretch the distribution. Actually, for the moyal distribution, which is supposed to be an approximation to the other distribution, it behaves as expected:
The code to produce those plots is this one:
from scipy.stats import levy_stable, moyal
import numpy
import plotly.express as px
import pandas

data = []
for loc in [0]:
    for scale in [1,5,10]:
        distributions = {
            'levy_stable': levy_stable(alpha=1,beta=1,loc=loc,scale=scale),
            'moyal': moyal(loc=loc,scale=scale),
        }
        for name,dist in distributions.items():
            x = numpy.linspace(loc-5*scale,loc+30*scale,999)
            df = pandas.DataFrame(
                {
                    'x': x,
                    'x/scale': x/scale,
                    'y': dist.pdf(x),
                }
            )
            df['loc'] = loc
            df['scale'] = scale
            df['distribution'] = name
            data.append(df)
data = pandas.concat(data)

fig = px.line(
    data,
    x = 'x/scale',
    y = 'y',
    facet_row = 'scale',
    color = 'distribution',
)
fig.update_yaxes(matches=None)
fig.write_html(f'deleteme/levy_stable_bug.html')


