I am looking to find structural breaks in a time series, using the strucchange breakpoints function in R. I wonder whether I need to detrend my data beforehand. Detrending might explain away valid structural breaks. There is a well-fitting quadratic trend, but I suspect that there are underlying reasons for this quadratic relationship that can. What would be the standard way to approach this?
1 Answer
Since no answer is given yet, let me take a stab with some quick biased thoughts plus demonstration. Foremost, I don't think there are such things as standard practice for your question; rather it depends all on the nature of the problems at hand as well as the domain knowledge.
Mathematically or statistically speaking, detrending a time series may or may not affect the detection of structural breaks, depending on what structural breaks are defined with respect to. For example, if there is a change in the mean somewhere in the time series, removing the linear trend will not affect the detection. Also, if the time series is just a quadratic trend curve, there is no "structural break" at all if the base model is a quadratic model, but there will be some "structural breaks" if the base model is a linear model. In other words, there are two moving pieces here: (1) what forms of the trend is being removed (e.g., linear, quadratic, or other forms), and (2) what base model is used to fit the time series (e.g., piecewise linear, piecewise quadratic, or other forms)?
With that said, here is a demonstration on a simulated quadratic time series curve using a Bayesian changepoint detection package Rbeast my group developed (https://github.com/zhaokg/Rbeast):
set.seed(123)
y = 0.05*(-14:15)^2 + rnorm(30,1) # an artificial time series
plot(y)
Try to detect any "breaks" in the quadratic data using a pricewise linear model:
library(Rbeast)

o = beast(y, season='none')
o = beast(y, season='none', torder.minmax=c(0, 1) )

# the two lines above are equivalent: the order of piecewise models are limited
# to 0 (flat line) and 1 (linear model).
plot(o)
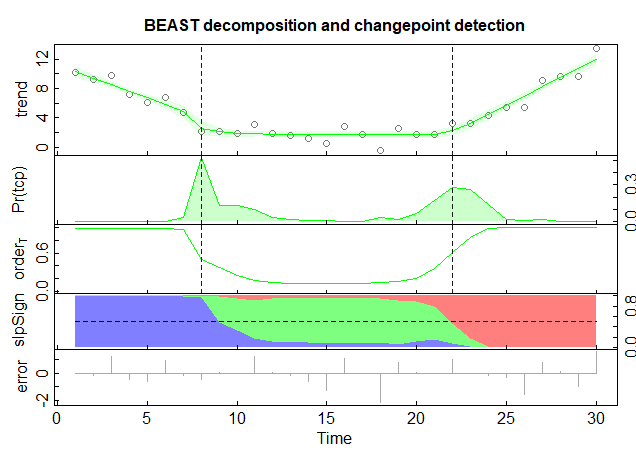
Not surpassingly, there are some breakpoints if a piecewise linear model is used. In the figure below, the Pr(tcp) subplot shows the changepoint occurrence probability over time, with the peaks indicating the most likely breakpoints. In this case, there are two breakpoints needed to fit the quadratic curve well.

Instead, for the same data, if fitting with a piecewise quadratic model by specifying torder.minmax=c(0,2) where 2 means the 2nd order model.
# Fit a piecewise quadratic model
o = beast(y, season='none', torder.minmax=c(0, 2) )
plot(o)
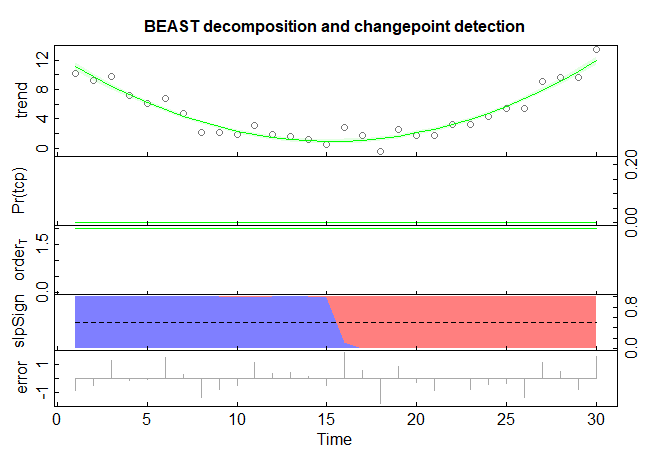
For the same time series, no breakpoint is detected (i.e., the flat changepoint probability occurrence curve close to zero) if the quadratic model is used as the base model to define structural beaks, as shown below.

As a further demonstration, we first remove the linear trend before detecting the breaks by setting detrend=TRUE, again using the piecewise linear model to define structural breaks,
o=beast(y, season='none', torder.minmax = c(0,1), dtrend=TRUE)
plot(o)
We got the same result as in the first figure. Removing a linear trend from the data will not affect the detection based on a piecewise linear model.

