5
$\begingroup$

My data set contains information regarding the number of road accidents separated by gender, age, area, and other factors. Can I perform logistic regression analysis using this dataset to predict how likely it is for a person to crash given certain characteristics? I guess my confusion is because I do not have data surrounding those who did not crash. Would the results of my analysis show that everyone is likely to have an accident, considering the data contains only information of those who have?

Am I correct in this thinking? If so, is there any other type of predictive analysis that I could perform on this dataset?

$\endgroup$
6
  • 1
    $\begingroup$ Welcome to Cross Validated! Do you have any variability in the outcome variable? $\endgroup$
    – Dave
    Commented Nov 29, 2023 at 19:33
  • 5
    $\begingroup$ How, exactly, were the data selected for this analysis? That is more important than in most questions of this nature because you intimate your data are not representative of the phenomenon you're interested in, so we need to figure out how -- if it's possible -- to compensate for the selection bias. Remember, too, that risk -- the likelihood of a crash -- requires a denominator: would these be crashes in a lifetime, at a particular intersection, per passenger mile, per year, or what? $\endgroup$
    – whuber
    Commented Nov 29, 2023 at 19:42
  • $\begingroup$ Data is collected by local police. Is there a selection bias here? $\endgroup$
    – Laura
    Commented Nov 29, 2023 at 20:00
  • $\begingroup$ Accidents are specified per year. $\endgroup$
    – Laura
    Commented Nov 29, 2023 at 20:13
  • 2
    $\begingroup$ @justhalf: Not a typo, I suspect, it's a fairly common use of the word. In older texts it tends to mean something like announce or state forthright, but in modern usage it's closer to imply or hint at. merriam-webster.com/dictionary/intimate $\endgroup$
    – AkselA
    Commented Nov 30, 2023 at 6:42

2 Answers 2

5
$\begingroup$

You are right that without data on those who didn't crash, you can't sensibly predict how likely a crash is. For example, maybe your data show there were twice as many crashes among young male drivers in County A than in County B -- but is that because County B is safer, or just because it has a smaller population?

If you can find data on population counts by gender, age, & area, then you can make a multi-way table that counts how many crashes and how many non-crashes there were for each gender-by-age-by-area combination. If you are in the US, data.census.gov may have this information, as long as the geographic areas you're working with are not too small. Then it may be possible to fit & interpret a logistic regression.

However, be aware that it might be more complicated if your crash data are recording where each crash took place, while the census data show where each person resides (if people don't crash in the same area where they live).

$\endgroup$
5
  • $\begingroup$ Thank you! I guess the only problem with your second point is, I would be assuming that the whole population drives? $\endgroup$
    – Laura
    Commented Nov 29, 2023 at 19:58
  • 1
    $\begingroup$ Yes, you're absolutely right -- you want to account for the number of drivers (or drivers and passengers, depending on your goals?), not just the number of people. Also, as others point out in the comments, most likely you'd want to adjust for the number of miles driven. I'm not sure where to find such data. $\endgroup$
    – civilstat
    Commented Nov 29, 2023 at 20:19
  • $\begingroup$ Another concern is whether you have data about all parties involved in a crash, or just the one that was found to be at fault. Do you care mostly about the "perpetrator" driver's risk of crashing, or mostly about the overall risk of being involved in a crash (as a "victim" driver, or a passenger, or a pedestrian who got struck, etc.)? $\endgroup$
    – civilstat
    Commented Nov 29, 2023 at 20:23
  • 1
    $\begingroup$ Thats a good point that I didn't think of! Ill check to see if data contains information regarding who was at fault or not. I think I probably need to refine my question further. Thanks for the food for thought! $\endgroup$
    – Laura
    Commented Nov 29, 2023 at 20:29
  • $\begingroup$ +1. I like this answer because it tries to include additional information that would provide a lot more context to the data generating process in this analysis. $\endgroup$ Commented Nov 29, 2023 at 20:56
3
$\begingroup$

The answer is pretty simple here. If your outcome variable has both outcomes (the event happens or doesn't happen), then you can easily fit this data to a logistic regression with the event as a binary response. If you only have data on people who have crashed, then its impossible to predict because your response is constant.

If the latter is true, you can consider tackling this from another perspective that doesn't involve the crashes themselves but instead the characteristics of the people in the data. For example, you can consider what the average age is of the people sampled, proportion of gender, etc. There may not be much you can do inferentially with this data given it only encompasses those who have crashed (which may have some bias given the non-crashers don't have a "voice" here).

Edit

Per the comments, you can theoretically flip the script here and try to predict whether crashers are male or female based off the other features in your data. For example, it may be the case that age influences the prevalence of crashes in one gender compared to another. You could fit the logistic regression such that:

$$ \text{Gender of Crasher} = \beta_0 + \beta_1 * \text{Age} + \epsilon $$

If the binary outcome is coded as $0$ being male and $1$ being female, then the intercept $\beta_0$ would represent the conditional log odds of being a female crasher and the slope $\beta_1$ would be the increase in log odds of this event given increases in age.

However, you would need to include some very important caveats in interpretation based on the fact that you only have crashers here, which may not represent the total population. Indeed males and females who don't crash may have systematic differences from crashers that is not observed in the data, and so your assumptions about the data would be very limited. This is particularly the case with observational data. Thus I think you can probably describe in a general sense what you see but not make strong claims about the analysis given this limitation.

Edit 2

The issue with interpretation with these results lies in the fact that there is no real counterfactual involved in the hypothesis (what could have happened if they didn't crash), as shown from the screen shot of this video, which shows a typical randomization process in experimentation:
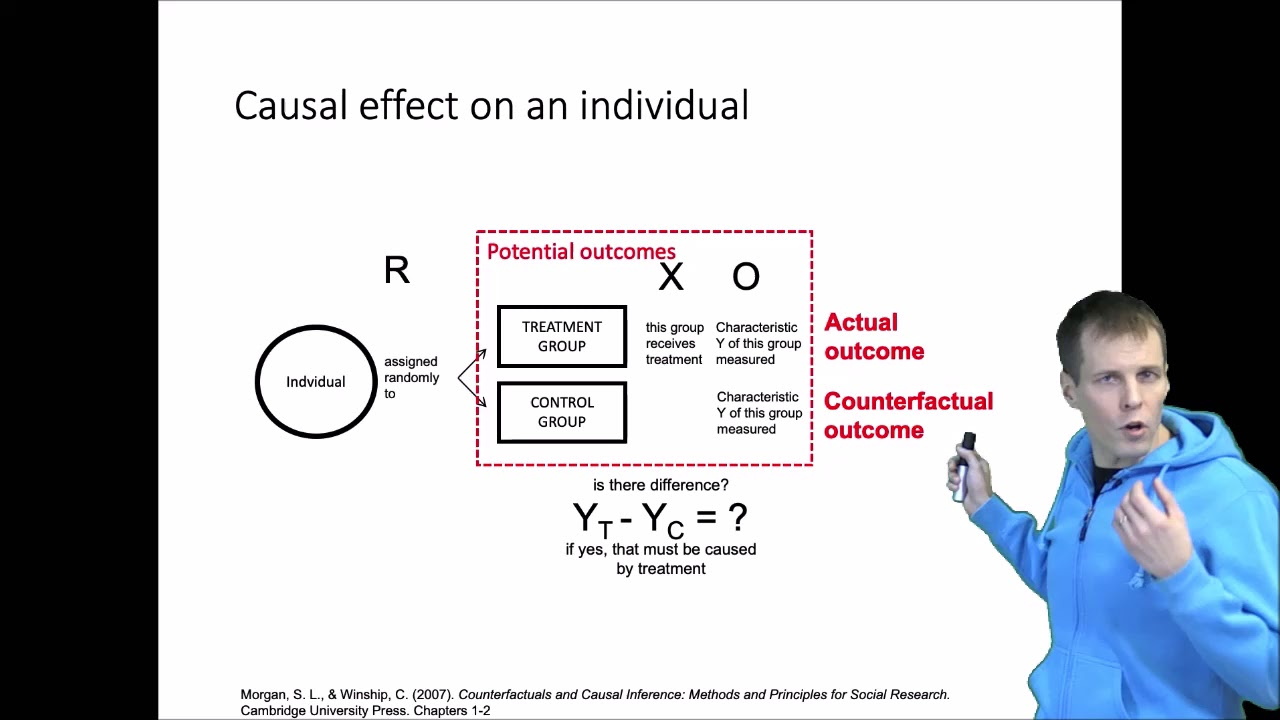
enter image description here

Naturally, if you report something like "crashers were twice as likely to be male" or "crashers were twice as likely to be male with a one unit increase in age", it heavily implies that males are more prone to crashing in general and may impress on people that crashing is a gender-based phenomenon, when we simply don't have the data to say that with confidence. You can instead say something like "It was found that males were twice as likely to be reported crashers in this dataset" and explain the caveats I mentioned.

The key here is to be very careful about any causal claims. You can only describe what you see in this kind of scenario. I will add that civilstat's answer is probably better given it tries to account for this in some way, but that depends on if you can get that data.

$\endgroup$
13
  • $\begingroup$ Is there any sort of significance testing I could complete on the dataset? See if there is significant differences between males and females for example? $\endgroup$
    – Laura
    Commented Nov 29, 2023 at 20:03
  • $\begingroup$ Thanks for your help also! $\endgroup$
    – Laura
    Commented Nov 29, 2023 at 20:03
  • $\begingroup$ I've edited my answer according to your comments. $\endgroup$ Commented Nov 29, 2023 at 20:16
  • $\begingroup$ Okay so I could understand more about the relationships between characteristics of crashers but not differences in the characteristics of crashers and non crashers! $\endgroup$
    – Laura
    Commented Nov 29, 2023 at 20:25
  • $\begingroup$ The data is also separated for multiple years - therefore could I complete a paired t test to see if there was a significant difference between these years? $\endgroup$
    – Laura
    Commented Nov 29, 2023 at 20:50

Your Answer

By clicking “Post Your Answer”, you agree to our terms of service and acknowledge you have read our privacy policy.

Not the answer you're looking for? Browse other questions tagged or ask your own question.