4
$\begingroup$

I am trying to predict ambulance demand for the next hour, for a city area in the USA, based on previous demand, weather, large people gatherings, and similar spatio-temporal factors.

I have noticed some points where the features are 'usual' - e.g. a "sunny peaceful Sunday afternoon", but there is unusually high demand - maybe because of a big traffic accident - on which I don't have any data. Thus I decided to try outlier detection and get rid of those points where the target doesn't depend on the data I have - but rather on something else, e.g. an accidental fire that injures some people, but can't be predicted.

I don't like univariate methods like IQR and z-scores, because some high demands might actually depend on the data - bad weather, large gatherings which I have data on, etc. On the other hand, multivariate unsupervised methods might detect extremely bad weather as on outlier, as they are not aware of what the target variable is, and work with the whole dataset trying to find irregular patterns. I can't use supervised methods which need an 'outlier' label, as I don't have an idea of what an outlier is yet - I need an algorithm for that, and that is my actual goal.

My question is: are there outlier detection methods that are aware of what the target variable is? For example: let's say I build a cluster of all sunny peaceful Sunday afternoons, and inspect the demand. I might see: $[1, 2, 0, 2, 1, 11, 2, 0]$ Then the $11$ is an outlier, because it belongs to the cluster of 'regular' Sunday afternoons, where the usual demand is around $1$.

Are there methods that do this already? If not, what would you recommend for me to do?

$\endgroup$
2
  • 1
    $\begingroup$ This will bias your results making it look like less accidents will happen on average, as you have removed all the "outliers" which do not conform to your theory. $\endgroup$ Commented Dec 1, 2023 at 13:24
  • $\begingroup$ Relevant picture: stats.stackexchange.com/a/656/18417 $\endgroup$ Commented Dec 2, 2023 at 8:58

3 Answers 3

7
$\begingroup$

I would strongly urge you NOT to do this. it is cheating. Your results will be a lie. And your predictions will look far too good. If you use this for forecasting demand, you will go wrong. In particular, you will miss "black swans" and have far too few ambulances available.

Outliers are important. They should not be deleted in this sort of fashion.

$\endgroup$
5
  • 1
    $\begingroup$ Thanks for the answer Peter! Might I ask some follow-up questions? 1) I have seen outlier handling as a preprocessing step in many cases online. Are they all wrong, or are there actual cases where outlier handling is recommended? 2) I would also like to do this as a part of EDA - proving that the use-case is hard and that some points don't depend on the data I have currently. Would you see this as a valuable step, and how would you approach it? $\endgroup$ Commented Dec 1, 2023 at 13:35
  • $\begingroup$ 1) I won't say ALL are wrong, but, in general, yeah, doing this automatically is a big problem. 2) Could be valuable, but I think there might be easier ways to prove this point. Indeed, the fact that your model doesn't work perfectly is a sign of this, and the mere existence of outliers is another sign. It's easy to show that e.g. "On July 6 there was a huge demand" and then you could look at newspapers or whatever and see that it was due to some weird accident or whatever. $\endgroup$
    – Peter Flom
    Commented Dec 1, 2023 at 13:42
  • $\begingroup$ Thanks Peter for the clarification, I'll listen to your advice and drop the approach $\endgroup$ Commented Dec 1, 2023 at 14:11
  • 1
    $\begingroup$ It is important to note if there are outliers if they are found, but whether or not you remove them is an entirely different question, which Peter and I agree on with respect to simple deletion. $\endgroup$ Commented Dec 2, 2023 at 5:00
  • $\begingroup$ Coming from a predictive modeling perspective, removing outliers like this isn't cheating if it's only done on a training set, and any data used for validation is untouched. It's still probably not a great thing to do. Usually one would use some form of regularization to avoid over-fitting to noisy observations; such as using robust regression as suggested in the other answers. $\endgroup$ Commented Dec 2, 2023 at 20:56
3
$\begingroup$

As Peter noted already, simple outlier deletion is often a bad decision. In fact, it can often cause more problems once the data is deleted, as the model will consider other points outliers. Here I offer some solutions:

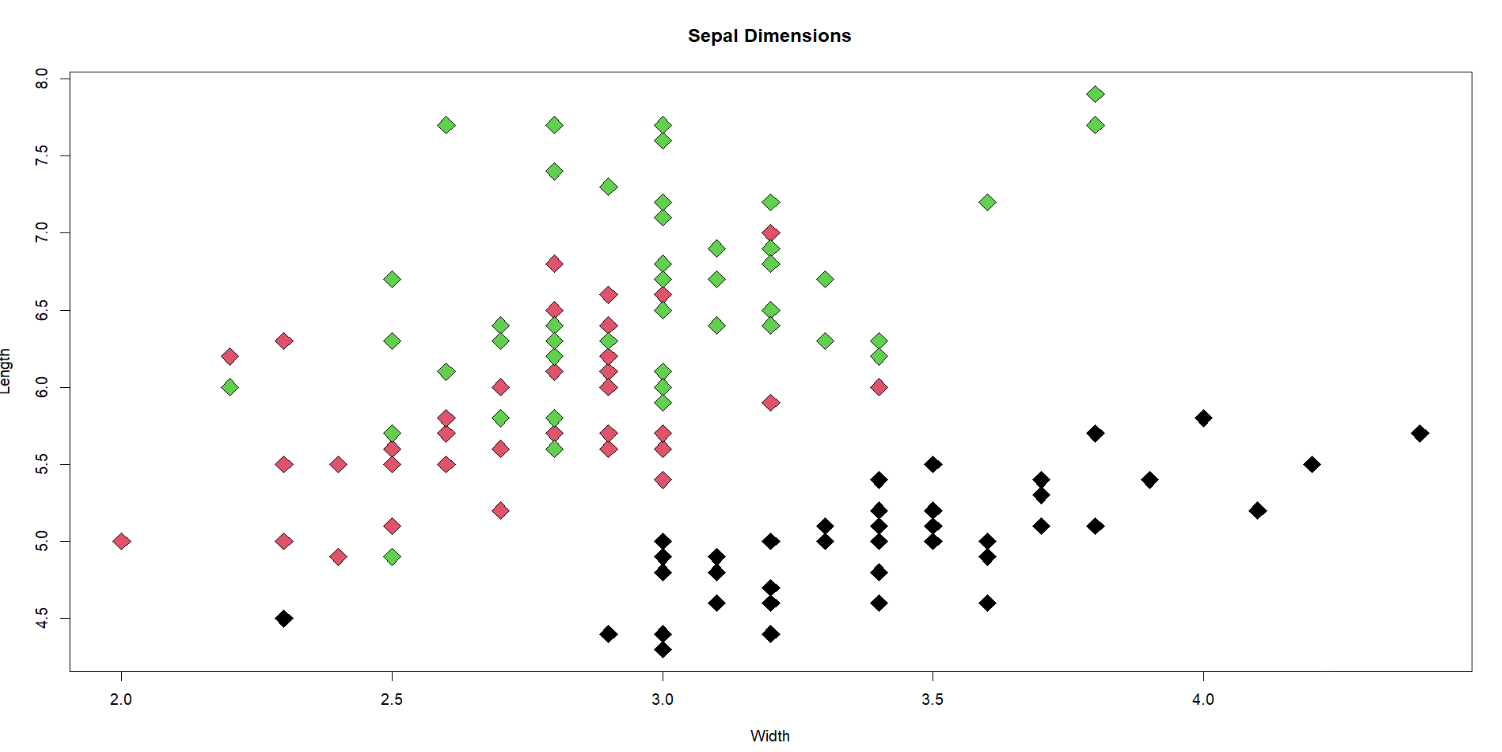
  • Do some detective work to see if there are "systematic outliers". As you noted, some data may cluster together and form relationships which are unaccounted for in the model. For example, you may have a "clump" of data in one area that is almost in an island of its own on a scatterplot. This may indicate that there is some non-independence of data (e.g. if Manhattan ambulance demand is often very different from Brookyln demand). If this is the case, you may have confounding effects like the Simpson Paradox, where you will need to model the data to fit this relationship. As an example, here is data with clear by-group differences (the bottom group has far larger widths and far lower lengths on average), where the sepal dimensions are separated into two distinct clusters of data:

enter image description here

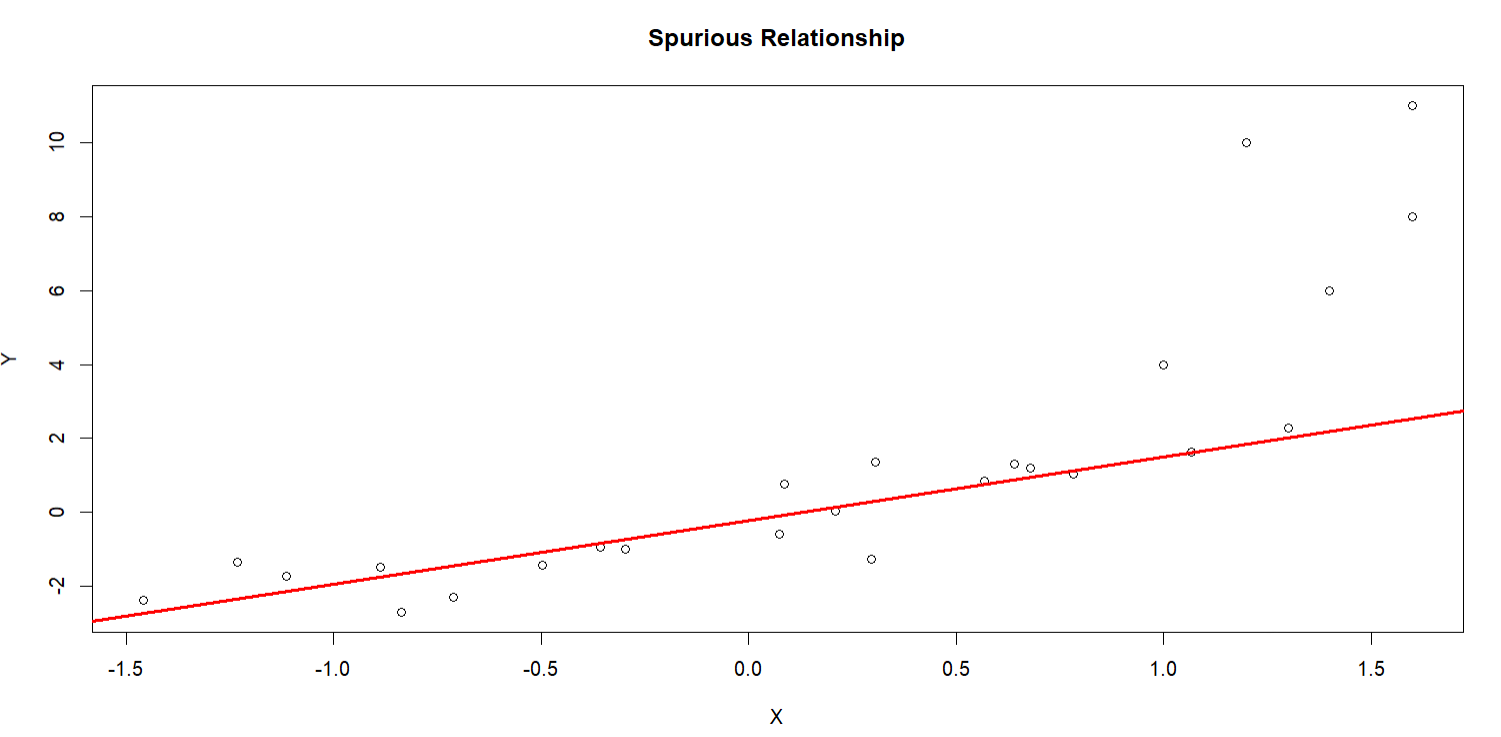
  • Similarly, check that you are modeling the correct functional relationship that the data is showing. If for example the data looks to be curvilinear, you may need to fit some form of nonlinear regression such as polynomial regression, splines, or generalized additive models (GAMs). You should usually check what plausible relationship is driving the data before moving on to other methods. Sometimes this will be hard to tell, particularly with small samples. For example, here is data generated with an exponential relationship. Are they outliers? Are they behaving the way they should be? Thinking about prior research and what the data generating process (DGP) should look like are key in this decision making.

enter image description here

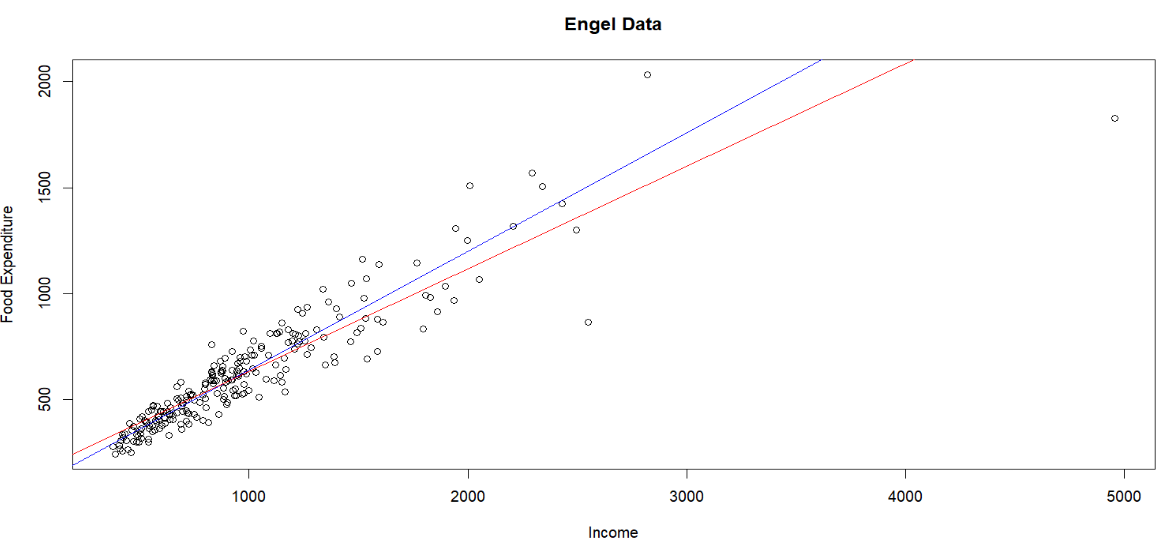
  • Use robust regression or quantile regression (using the conditional median rather than the typical conditional mean in normal regressions) if the model is otherwise correctly specified. These methods basically reweight the residuals so that points that are especially far away from where they should be are given "less attention." Below I show two regression fit with the normal OLS method in (conditional mean) and the quantile method in blue (conditional median). Here we can see that the outliers really sway the red line towards their direction, but the median is barely affected if at all.

enter image description here

I mention other issues related to outliers here.

$\endgroup$
3
  • $\begingroup$ I would note that this depends on the data set. If you have reason to suspect that most outliers of a given type are not "real" values but rather the result of bad data collection, it can be productive to remove them. If people are entering their birth year in a form, for instance, and 5% of the ages are over 110, it's probably best to assume that those ages are almost all being entered incorrectly and remove or try to correct them, rather than keeping them in the hope that they will actually predict something relevant for extremely old people. $\endgroup$
    – Obie 2.0
    Commented Dec 2, 2023 at 10:10
  • $\begingroup$ (Though if you want to predict how well people enter data, they might be of use). $\endgroup$
    – Obie 2.0
    Commented Dec 2, 2023 at 10:15
  • $\begingroup$ Yes my suggestions are those which I recommend after examining whether or not the values are real, something I note in the linked answer. $\endgroup$ Commented Dec 2, 2023 at 12:48
3
$\begingroup$

If linear regression is an appropriate model for the non-outliers, you can run a robust linear regression as provided by the MM-estimator, implemented by the lmrob-function in the R-package robustbase. This will not or only weakly be affected by the outliers, and the outliers in the response can be spotted as having large robust residuals (to be seen by diagnostic plots as in plot.lmrob; ultimately labelling a point as "outlier" will depend on setting a threshold value as generally required for outlier detection). Such an analysis by the way does not involve or require deleting the outliers, which is not advisable as said by others, unless you know that they are in fact erroneous.

Robust versions exist also for estimators of other models such as glmrob for generalised linear models. Also some prediction models are not affected much by outliers anyway (trees/forests can isolate them for example).

$\endgroup$

Your Answer

By clicking “Post Your Answer”, you agree to our terms of service and acknowledge you have read our privacy policy.

Not the answer you're looking for? Browse other questions tagged or ask your own question.