2
$\begingroup$

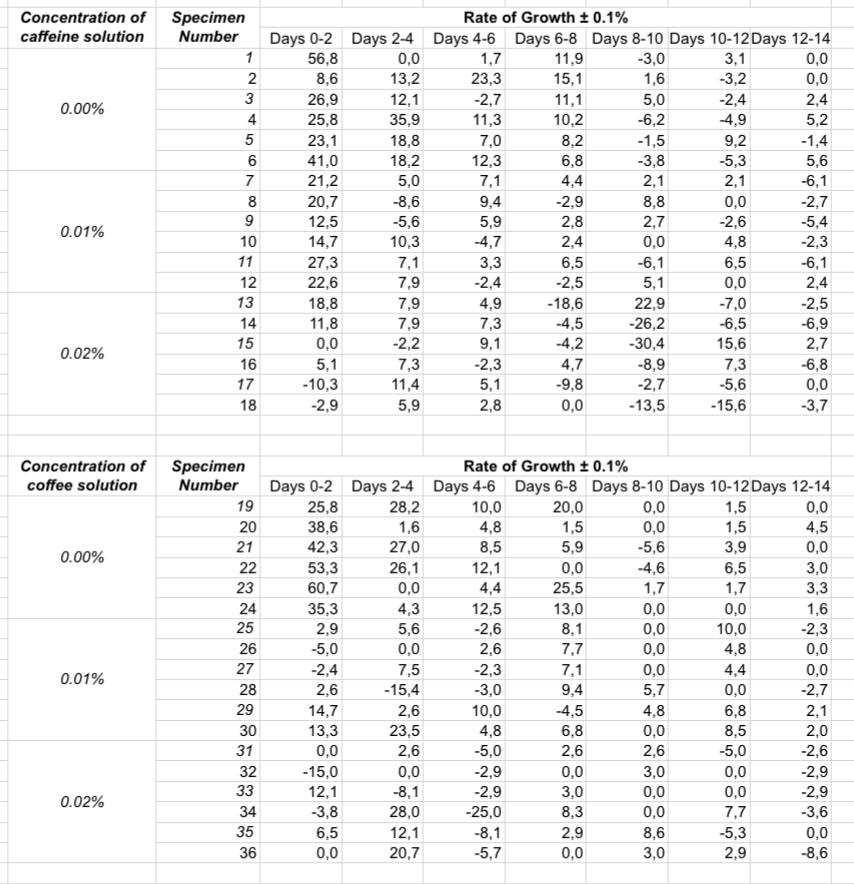
I have conducted an experiment for my Biology Internal Assessment in the IB Diploma Course where I grew Phaseolus coccineus beans for 14 days. This is the overview of my experiment: Independent Variable: Concentration of caffeine (trimethylxanthine) in aquatic solutions of coffee grounds (Coffea arabica) and caffeine introduced into the soil: 0.00% ,0.01% and 0.02%. Dependent Variable: Plant growth measured as a percentage change in biomass (g). Results: Biomass of each specimen over time Rate of growth calculated for each time interval
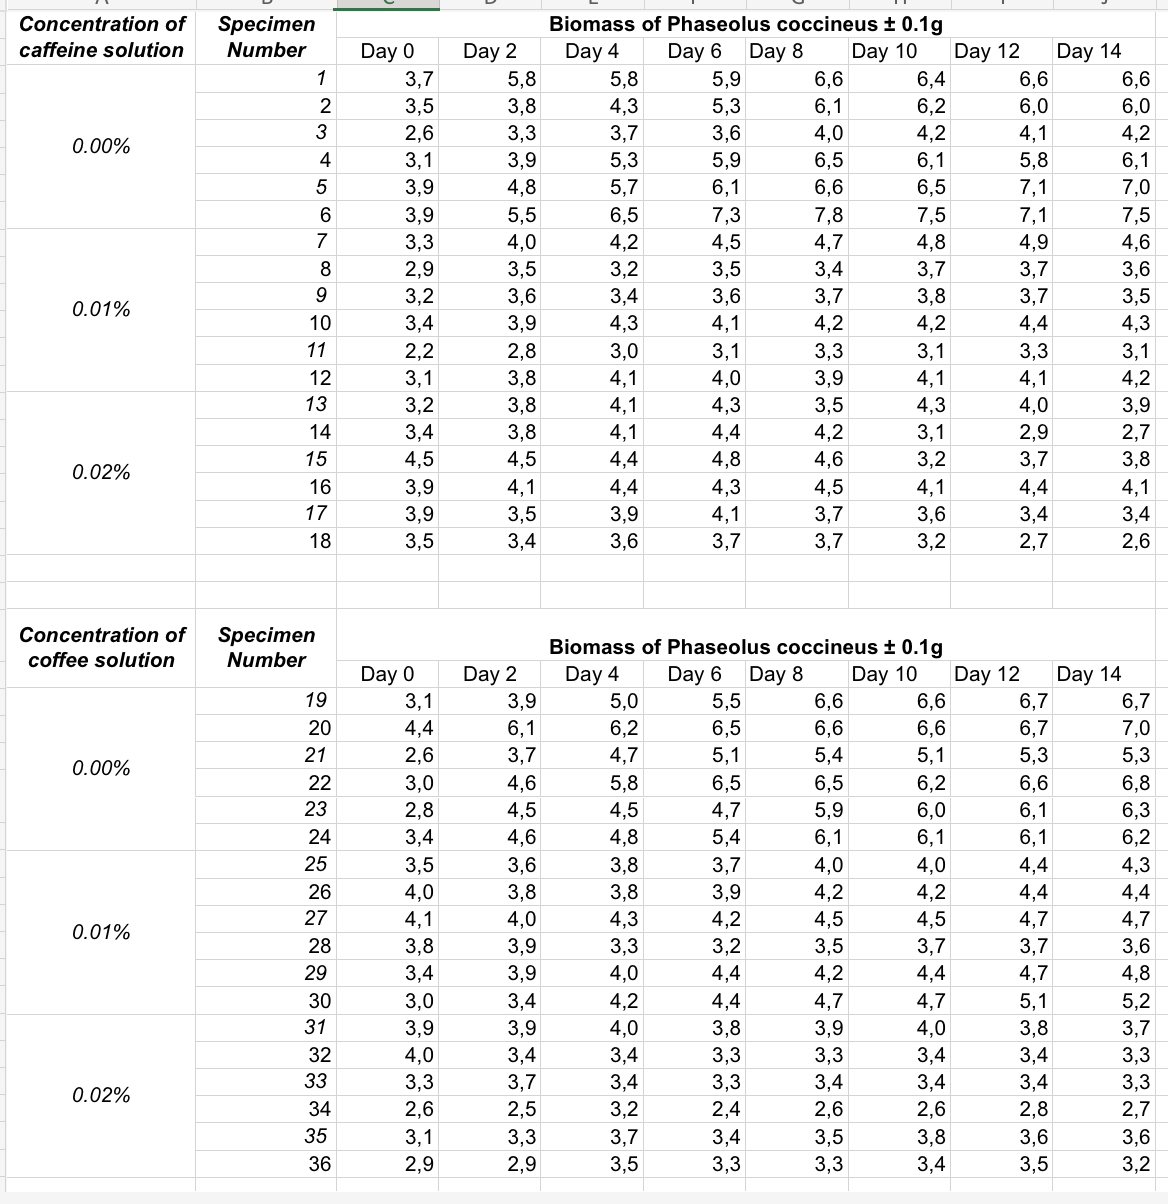
As you can see I cultivated 6 plants in each concentration of caffeine (18 plants were watered with coffee and 18 with pure caffeine). I need to perform a statistical test where I will compare if the increasing caffeine concentration (in coffee or pure caffeine) had an effect on the rate of growth (the test will be performed two times - for the coffee group and for the caffeine group). My issue is that I have 3 different concentrations (0.00%, 0.01% and 0.02%) and during the 14 day period (I measured the biomass every 2 days) all plants have followed a similar pattern where they first grew more rapidly and then the rate of growth declined. The main difference is that the rate of growth values declined with the rising concentration (i.e. the patterns as similar for all but the values changed). Can you advise me which test I should use to check if the difference between the results is statistically significant?

$\endgroup$
2
  • $\begingroup$ Welcome to Cross Validated! Do you have the actual biomass values in grams over time? It would help if you could show a plot of average biomass over time for these conditions. Percents and percentage changes can be misleading and hard to model and interpret. See this post. If you have the actually biomass values this might just need a simple application of "growth curve" analysis (generalized least squares). See this reference. $\endgroup$
    – EdM
    Commented Dec 1, 2023 at 16:50
  • $\begingroup$ Yes, I do have the biomass in grams over time. I will add it as an image to my post in a second. $\endgroup$
    – Maja
    Commented Dec 1, 2023 at 19:15

1 Answer 1

2
$\begingroup$

The biomass amounts in grams* over time can be handled by standard methods.

Two main predictors would be the caffeine concentrations and whether the source was pure caffeine or coffee grounds. If you think that there is something beyond an additive effect of concentration and source you could include an interaction term between concentration and source. Adding unnecessary interactions, however, can make it harder to find true differences. Tests on those coefficients address your hypotheses.

You also need to include a model of how the biomass changes over time. If you just use the Day value for time in the model, software might by default enforce a linear growth. That doesn't seem consistent with your data. If instead you use all the Day values as individual levels of a categorical predictor, you will be trying to estimate too many coefficients. A regression spline is a reasonable compromise, letting the data help describe the shape without fitting more than a few coefficients.

You also need to take into account the correlations of observations within individual specimens. There are a few different approaches, explained in Chapter 7 of Frank Harrell's Regression Modeling Strategies. A generalized least squares ("growth curve") model as explained in that chapter could work well. It allows for more types of potential correlations over time within an individual than do the "mixed models" that tend to receive more attention.

If the Day 0 values can be taken to be the mass before treatment, you should include that value for an individual as a predictor in the model for all the subsequent observations on that individual. See this page for an explanation.


*You usually want to work with data as close as possible to the values that were actually measured. The repeated percentage change values are taking you farther away from the original data, and would be much harder to model and interpret. Percentages and percentage changes often end up creating confusion.

$\endgroup$

Your Answer

By clicking “Post Your Answer”, you agree to our terms of service and acknowledge you have read our privacy policy.

Not the answer you're looking for? Browse other questions tagged or ask your own question.