0
$\begingroup$

I am new to time series and wanted to practice it by forecasting an hourly time series. enter image description here The adf and kpss test results show that the series is stationary.
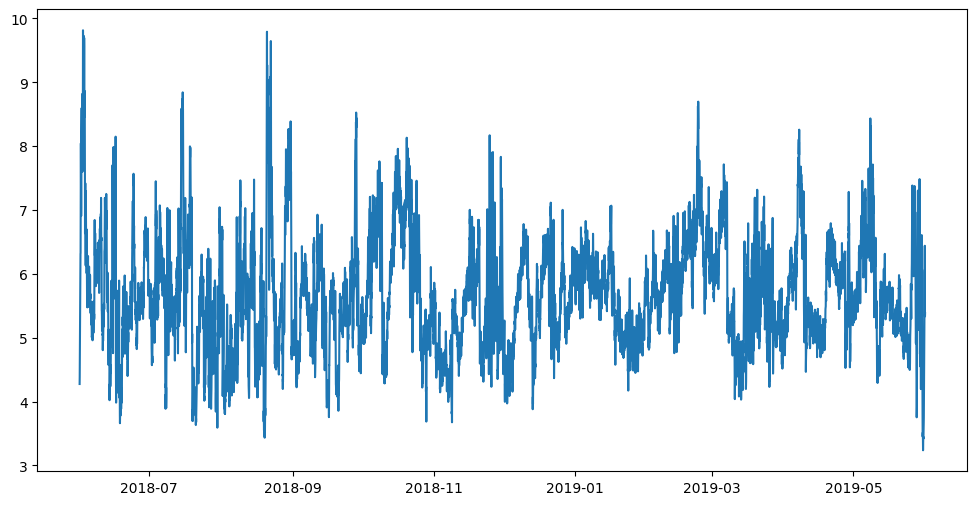
ADF test results

Test Statistic                -1.023836e+01
p-value                        4.822092e-18
#Lags Used                     2.500000e+01
Number of Observations Used    8.734000e+03
Critical Value (1%)           -3.431099e+00
Critical Value (5%)           -2.861871e+00
Critical Value (10%)          -2.566946e+00

KPSS test results

Test Statistic            0.109422
p-value                   0.100000
#Lags Used               54.000000
Critical Value (10%)      0.347000
Critical Value (5%)       0.463000
Critical Value (2.5%)     0.574000
Critical Value (1%)       0.739000

However, the pacf and acf plots show that the series is a random walk. enter image description here
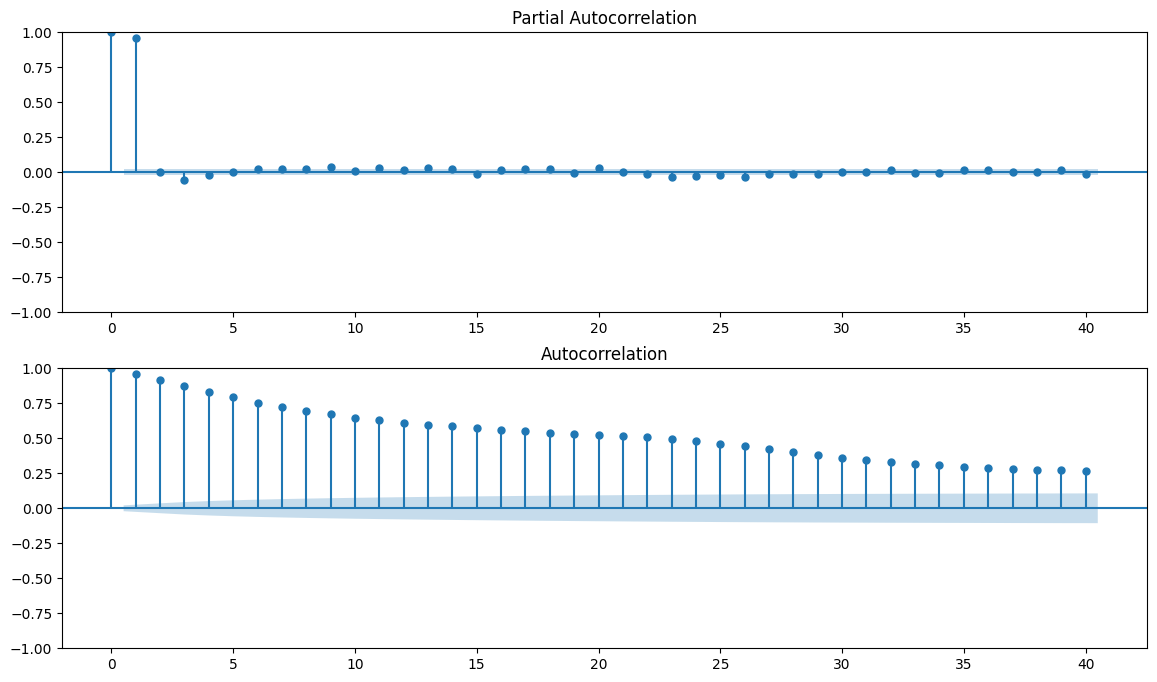
Is the series a random walk and is it possible to forecast it?

$\endgroup$
5
  • 1
    $\begingroup$ Hi: can you show a plot of the series itself ? That might help to get some answers. $\endgroup$
    – mlofton
    Commented Dec 25, 2023 at 8:36
  • $\begingroup$ I have added the plot for the series. $\endgroup$
    – Om Mali
    Commented Dec 25, 2023 at 16:07
  • $\begingroup$ Hi: I agree that the acf makes it look possibly not stationary but how do you conclude random walk. I forget all the rules for interpreting the acf and pacf so your conclusion could be correct. I'm just asking why ? I mainly ask because a random walk would tend not to hover around a constant mean like that series does. Also, a large + AR(1) coefficient ( near 1 ) can give an ACF sort of like yours, I totally forget the PACF rules. $\endgroup$
    – mlofton
    Commented Dec 26, 2023 at 17:54
  • $\begingroup$ I referred this : stats.stackexchange.com/questions/87000/… and came to the conclusion that its a random walk. The ACF and PACF plots in the post are similar to mine. $\endgroup$
    – Om Mali
    Commented Dec 27, 2023 at 1:17
  • $\begingroup$ that's fine. these things are part art and part science. but do notice that the acf in that picture is pretty different from the acf in your picture. I would compare the predictions of a random walk versus an AR(1) because, for high $\phi$, those two series are known to be quite difficult to differentiate from. $\endgroup$
    – mlofton
    Commented Dec 27, 2023 at 21:46

0

Your Answer

By clicking “Post Your Answer”, you agree to our terms of service and acknowledge you have read our privacy policy.

Browse other questions tagged or ask your own question.