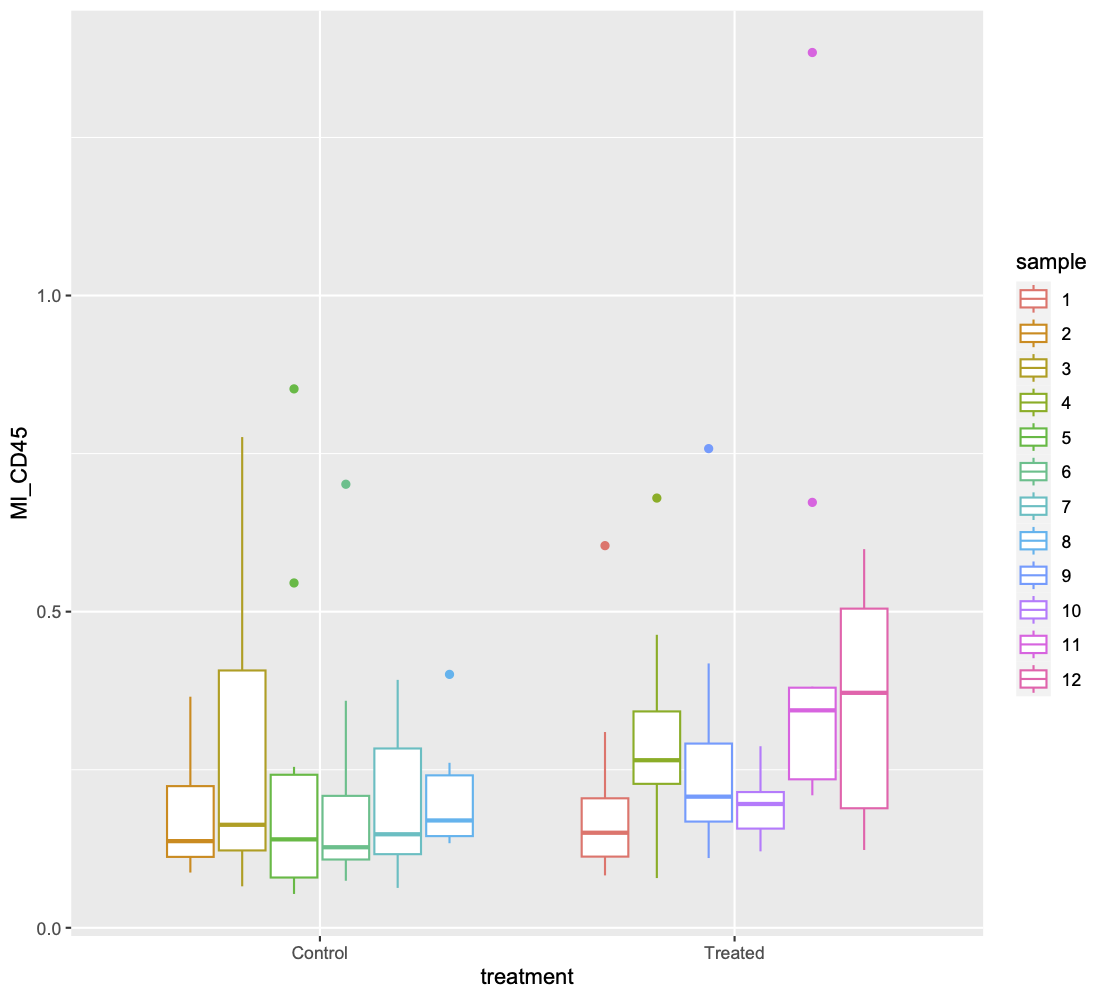
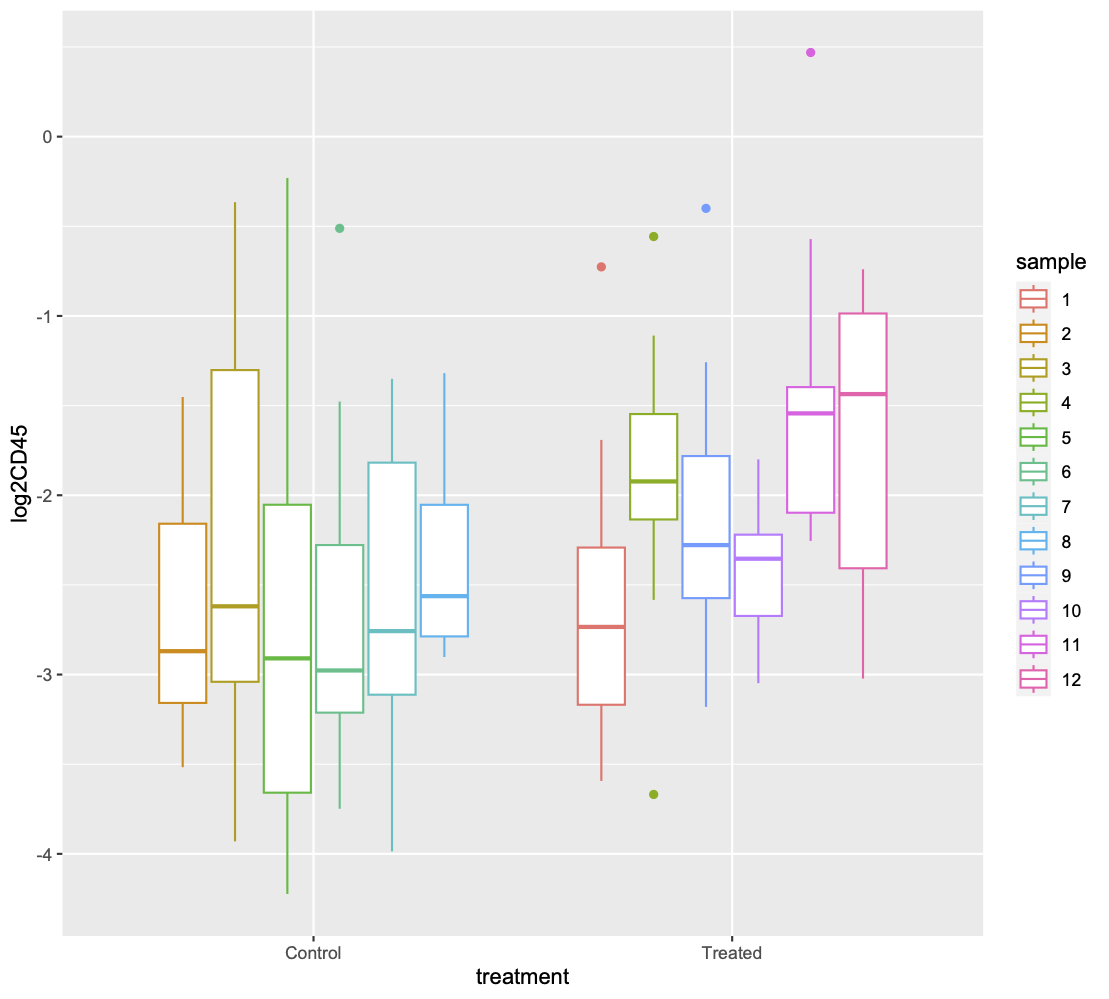
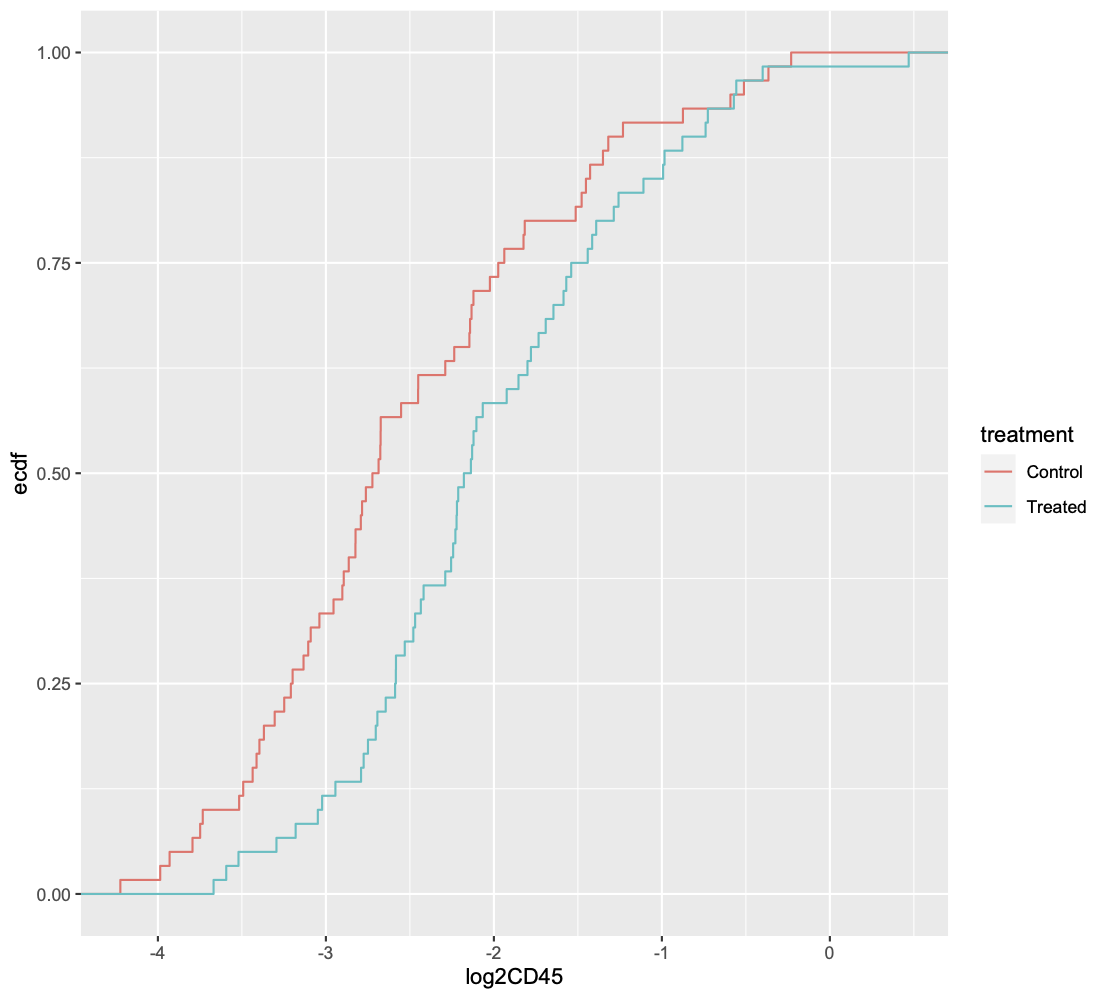
I acquired some protein expression data of one protein marker (e.g. CD45, expression range between 0-4, not necessarily integer and on a continuous scale) in a Control group and a Treated group. This is single cell imaging cell mass cytometry data, so I have the information for each individual cell. Each group contains 6 samples, each sample comprising 1000 cells.
We want to compare the expression of our protein marker between the 6,000 cells of the Control group and the 6,000 cells of the Treated group.
For each image separately, CD45 & other markers were normalised to the measured expression of a gas in the Hyperion machine. Then all 12 images were grouped together and the total dataset was scaled to 99th percentile.
How can I know whether expression data from these 2 groups is significantly different ? I am aware that a t-test can compare two groups but am wondering if I need to carry out something more sophisticated to factor in variance across multiple samples?
The 12 samples are all independent of each other.
For context I will be running this analysis in R or Python
I have included a reduced dataset with 10 cells per sample with info on sample number, treatment and mean CD45 expression to show what the data is like. The expression values have already been normalised across samples.
structure(list(sample = c(1L, 1L, 1L, 1L, 1L, 1L, 1L, 1L, 1L,
1L, 2L, 2L, 2L, 2L, 2L, 2L, 2L, 2L, 2L, 2L, 3L, 3L, 3L, 3L, 3L,
3L, 3L, 3L, 3L, 3L, 4L, 4L, 4L, 4L, 4L, 4L, 4L, 4L, 4L, 4L, 5L,
5L, 5L, 5L, 5L, 5L, 5L, 5L, 5L, 5L, 6L, 6L, 6L, 6L, 6L, 6L, 6L,
6L, 6L, 6L, 7L, 7L, 7L, 7L, 7L, 7L, 7L, 7L, 7L, 7L, 8L, 8L, 8L,
8L, 8L, 8L, 8L, 8L, 8L, 8L, 9L, 9L, 9L, 9L, 9L, 9L, 9L, 9L, 9L,
9L, 10L, 10L, 10L, 10L, 10L, 10L, 10L, 10L, 10L, 10L, 11L, 11L,
11L, 11L, 11L, 11L, 11L, 11L, 11L, 11L, 12L, 12L, 12L, 12L, 12L,
12L, 12L, 12L, 12L, 12L), MI_CD45 = c(0.1545877, 0.1793125, 0.1445191,
0.1019348, 0.08286311, 0.6044133, 0.3096269, 0.2132869, 0.08715424,
0.1460735, 0.08738686, 0.2297806, 0.365499, 0.1289996, 0.2122718,
0.101198, 0.121693, 0.1089632, 0.2279845, 0.1451246, 0.425867,
0.1139834, 0.6634371, 0.7761338, 0.1474155, 0.06559177, 0.1553516,
0.09389775, 0.3503682, 0.1704765, 0.3370313, 0.2912913, 0.2387781,
0.6796798, 0.07864064, 0.1668305, 0.463418, 0.3439344, 0.2285349,
0.2273838, 0.1829566, 0.09678843, 0.07209037, 0.5453814, 0.8523626,
0.07520846, 0.2545249, 0.204567, 0.09239703, 0.05353002, 0.1567345,
0.1373628, 0.07440487, 0.3590844, 0.2259703, 0.08887248, 0.1052557,
0.1162133, 0.7015316, 0.1174095, 0.392122, 0.1412689, 0.1081716,
0.09501558, 0.06310009, 0.1514402, 0.2839504, 0.2825152, 0.1443816,
0.3718398, 0.4008126, 0.2265992, 0.2609764, 0.1345574, 0.1566612,
0.1411953, 0.1564614, 0.1828695, 0.1337754, 0.2459216, 0.166302,
0.2635781, 0.4181116, 0.1849425, 0.7578567, 0.1300071, 0.110335,
0.2298646, 0.3006229, 0.1730745, 0.1535573, 0.2113298, 0.1487033,
0.1209101, 0.2045534, 0.2157926, 0.1669114, 0.187058, 0.2326026,
0.2871616, 0.368213, 0.3813162, 0.6728588, 0.2095521, 0.3196558,
0.2208793, 0.2146631, 0.2767163, 0.375026, 1.384382, 0.1599959,
0.5988706, 0.4100114, 0.5025848, 0.2143242, 0.3332356, 0.544148,
0.5055255, 0.1230738, 0.1806344), treatment = c("Treated", "Treated",
"Treated", "Treated", "Treated", "Treated", "Treated", "Treated",
"Treated", "Treated", "Control", "Control", "Control", "Control",
"Control", "Control", "Control", "Control", "Control", "Control",
"Control", "Control", "Control", "Control", "Control", "Control",
"Control", "Control", "Control", "Control", "Treated", "Treated",
"Treated", "Treated", "Treated", "Treated", "Treated", "Treated",
"Treated", "Treated", "Control", "Control", "Control", "Control",
"Control", "Control", "Control", "Control", "Control", "Control",
"Control", "Control", "Control", "Control", "Control", "Control",
"Control", "Control", "Control", "Control", "Control", "Control",
"Control", "Control", "Control", "Control", "Control", "Control",
"Control", "Control", "Control", "Control", "Control", "Control",
"Control", "Control", "Control", "Control", "Control", "Control",
"Treated", "Treated", "Treated", "Treated", "Treated", "Treated",
"Treated", "Treated", "Treated", "Treated", "Treated", "Treated",
"Treated", "Treated", "Treated", "Treated", "Treated", "Treated",
"Treated", "Treated", "Treated", "Treated", "Treated", "Treated",
"Treated", "Treated", "Treated", "Treated", "Treated", "Treated",
"Treated", "Treated", "Treated", "Treated", "Treated", "Treated",
"Treated", "Treated", "Treated", "Treated")), row.names = c(32376L,
31483L, 26108L, 9290L, 39029L, 13975L, 8904L, 7043L, 30854L,
28262L, 61943L, 62499L, 59538L, 44945L, 49756L, 48593L, 57793L,
51017L, 51676L, 61591L, 74993L, 80774L, 75583L, 80449L, 66765L,
86362L, 73016L, 86895L, 70177L, 74650L, 98852L, 97693L, 121342L,
99156L, 111652L, 115560L, 117963L, 105585L, 112108L, 116307L,
142252L, 127436L, 124329L, 132183L, 127607L, 141529L, 127357L,
128249L, 133640L, 123272L, 160252L, 173527L, 174041L, 161181L,
158121L, 168710L, 170645L, 166045L, 169275L, 170357L, 185508L,
184176L, 176645L, 177849L, 181230L, 179293L, 177097L, 185926L,
176611L, 186402L, 191758L, 196205L, 191362L, 206817L, 187058L,
197708L, 189013L, 193915L, 197749L, 188210L, 214891L, 214353L,
211243L, 216867L, 215698L, 211359L, 211004L, 208673L, 217491L,
208737L, 219605L, 225965L, 219584L, 227512L, 228393L, 219070L,
226765L, 230550L, 225558L, 225561L, 236993L, 239767L, 253503L,
242694L, 253704L, 244407L, 248366L, 247806L, 244830L, 240108L,
263171L, 273190L, 279033L, 266438L, 281753L, 280685L, 274369L,
280756L, 266414L, 266935L), class = "data.frame")


