I have this mixture of a shifted binomial and discrete uniform: $$ P(R=r)=\left\{ \pi\binom{m-1}{r-1} (1-\xi)^{r-1}\xi^{m-r}+(1-\pi){1\over m}\right\} $$ Having fixed $\xi$, $\pi$, $m$ to be specific values, how can I generate N values for the random variable $R$? Let's say for example N = 100, 300 and 900.
2 Answers
The "shifted Binomial" is a Binomial distribution for $R-1$ with parameters $m-1$ and $\xi$.
In general, to draw from a mixture of distributions, select one component of that mixture at random according to its proportion in the mixture ($\pi$ for the shifted Binomial, $1-\pi$ fo the discrete uniform) and then independently draw from that component.
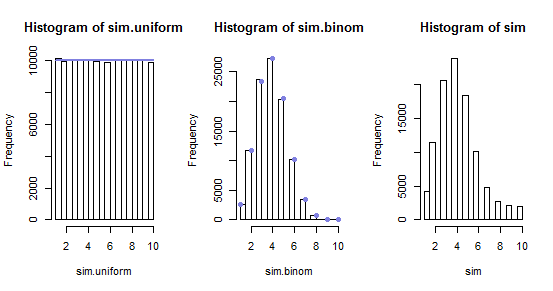
Here are plots of draws from two such components (with the parent distributions marked in blue) and from the mixture. The binomial consists of $\pi = 4/5$ of the mixture here.

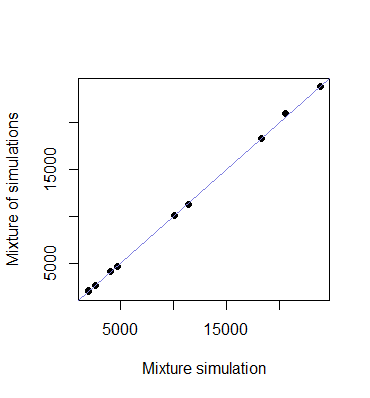
The component histograms closely match their parents, indicating they were correctly simulated. The histogram of the draws from the mixture (at right) should look like a weighted mixture of the two component histograms, which it does. We may more precisely compare these using a scatterplot:

Yes, they agree (to within sampling error). The algorithm appears to be working correctly.
This R code is constructed (a) to parallel this prescription for drawing from a mixture and (b) to work generally for any finite mixture (of one or more distributions) represented as an array of proportions and a parallel array of functions used to draw pseudorandom values.
#
# Define the component distributions.
#
runif.discrete <- function(n, m) floor(runif(n, 1, m+1))
rbinom.shift <- function(n, shift, size, prob) rbinom(n, size-shift, prob) + shift
#
# Draw `n` iid values from a given mixture of components.
#
rmixture <- function(n, components, probs) {
  k <- length(components)
  f <- sample(components, n, replace=TRUE, prob=probs)
  sapply(f, function(g) g(1))
}
#
# As an example, supply some concrete values for the parameters.
#
m <- 10   # Binomial parameter
xi <- 1/3 # Binomial paameter
f1 <- function(n) rbinom.shift(n, 1, m, xi)
f2 <- function(n) runif.discrete(n, m)
#
# To test, draw separately from each of the components, then from
# a mixture.
#
par(mfrow=c(1,3))
set.seed(17)
N <- 10^5    # Simulation size
p <- 0       # Amount of binomial in the mixture
sim.uniform <- rmixture(N, c(f1, f2), c(p, 1-p))
table(sim.uniform)
hist(sim.uniform)
curve(N/m + 0*x, add=TRUE, col="#8080e0", lwd=2)

p <- 1
sim.binom <- rmixture(N, c(f1, f2), c(p, 1-p))
table(sim.binom)
hist(sim.binom)
points(N * dbinom(1:m-1, m-1, xi), col="#8080e0", pch=19)

p <- 4/5
sim <- rmixture(N, c(f1, f2), c(p, 1-p))
table(sim)
hist(sim)
#
# The mixture distribution ought to match the weighted combination of the
# component distributions, up to chance variation.  Verify this by comparing
# a scatterplot to a diagonal line.
#
par(mfrow=c(1,1))
plot(tabulate(sim, nbins=m), pch=19,
     p*tabulate(sim.binom, nbins=m) + (1-p)*tabulate(sim.uniform, nbins=m),
     xlab="Mixture simulation", ylab="Mixture of simulations")
abline(c(0,1), col="#8080e0")
-
-
$\begingroup$ @user2835597 This thread concerns sampling from a distribution with known parameters. The question of estimating parameters is different: there is little in this thread relevant to that issue. Please search our site for fit mixture distribution. $\endgroup$– whuber ♦Commented Jun 8, 2015 at 13:00
All you need to do is to be able to sample from a negative binomial distribution (shifted binomial) and the discrete uniform distribution, both of which R has functions for. Once you have done that, you simply need to sample continuously from the Uniform(0,1) distribution to decided whether or not you keep the sample from the nagtive binomial part of the distribution or the discrete uniform. Here is some code for doing so:
#Fixed values
m = 10
pi = .25
xi = .4

#Number of samples desired
N = 1000

#Sample from the first mixture component
part1 = rnbinom(N,m,xi)

#Sample from the second mixture component
part2 = sample(1:m,N,replace=TRUE)

#Decide which mixture component to choose from
mixture = runif(N)

#Obtain samples of r
r = ifelse(mixture<pi,part1,part2)
-
1$\begingroup$ Well done! Are you sure, though, that the implementation of the negative binomial distribution in
Ris the same as the formulation in the question? $\endgroup$ Commented Jul 11, 2013 at 15:05 -
$\begingroup$ Actually your right! They are very close en.wikipedia.org/wiki/… but not exactly the same. The same idea applies above, now he just needs to figure out how to sample from the shifted binomial. $\endgroup$– user25658Commented Jul 11, 2013 at 15:22
-
$\begingroup$ Exactly! I tried the same approach as you, but I couldn't figure out how to sample from the negative binomial as formulated in the question. $\endgroup$ Commented Jul 11, 2013 at 15:27
-
1$\begingroup$ @COOL The "shifted binomial" is a Binomial distribution with a scale change. It is not any form of a negative binomial distribution (which always has countable support, not finite support). $\endgroup$– whuber ♦Commented Jul 11, 2013 at 15:56
-
1$\begingroup$ @COOLS: support, countable. The "shifted binomial" has nonzero probability only for the $m$ possible values $1, 2, \ldots, m$. All negative binomial distributions have nonzero probabilities for the values $0, 1, 2, \ldots,$ which are infinite in number. Therefore it is hopeless to look for a negative binomial method of drawing from a shifted binomial distribution. $\endgroup$– whuber ♦Commented Jul 11, 2013 at 16:44
