0
$\begingroup$

This poster has been making headlines lately due to its subject and conclusions. Specifically, I'm interested in understanding how the hazard ratios are being calculated in this table: enter image description here
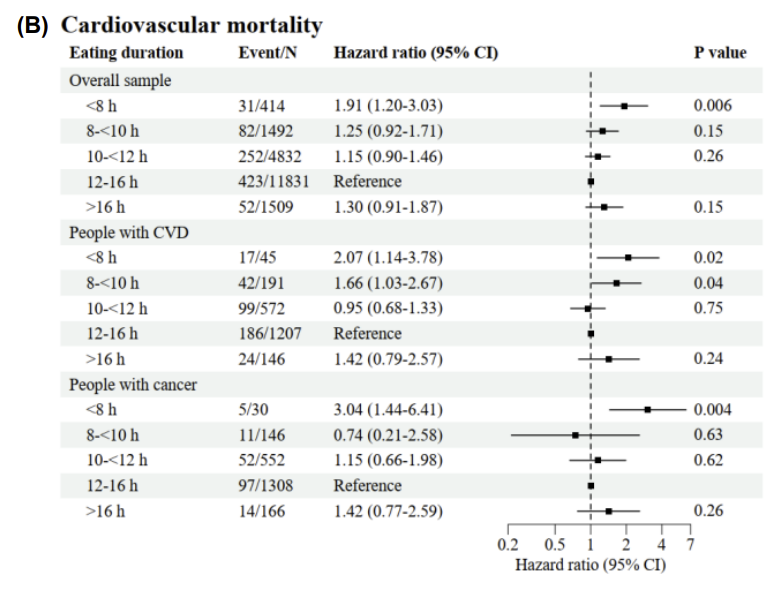
For example, let's take the "Overall sample" example. The reference group "12-16 h" has 423 events and a sample of 11831, for group "<8 h" they have 31 events and N of 414. To calculate the hazard ratio of group "<8 h" I figured it'd just be the hazard of that group divided by the hazard of the reference group:

(31/414) / (423/11831)

However this would equal 2.09 not 1.91 as referenced. Could someone explain what is being shown / calculated and how they are getting to 1.91? (Or provide code that would recreate these hazard values given the sample.)

$\endgroup$
2
  • 3
    $\begingroup$ As they explain in the methods this is an adjusted Cox model, so you won't be able to reproduce the estimates without knowing all covariates (age, BMI, food intake, diet quality..) in the sample. $\endgroup$
    – PBulls
    Commented Mar 25 at 6:26
  • 2
    $\begingroup$ Furthermore, the n/N will let you calculate risk (or odds), but such model works on hazard (i.e. instantaneous risk over time), so just the event counts won't say much if you also don't know follow-up time. I'm no epidemiologist but this points out a difficulty in such analyses: how do you define the index time, or the point from which you start the clock? In a randomized controlled study it would be the point of randomization/intervention, here that seems less clear (also because people presumably don't diet from the day they are born). $\endgroup$
    – PBulls
    Commented Mar 25 at 7:40

0

Your Answer

By clicking “Post Your Answer”, you agree to our terms of service and acknowledge you have read our privacy policy.