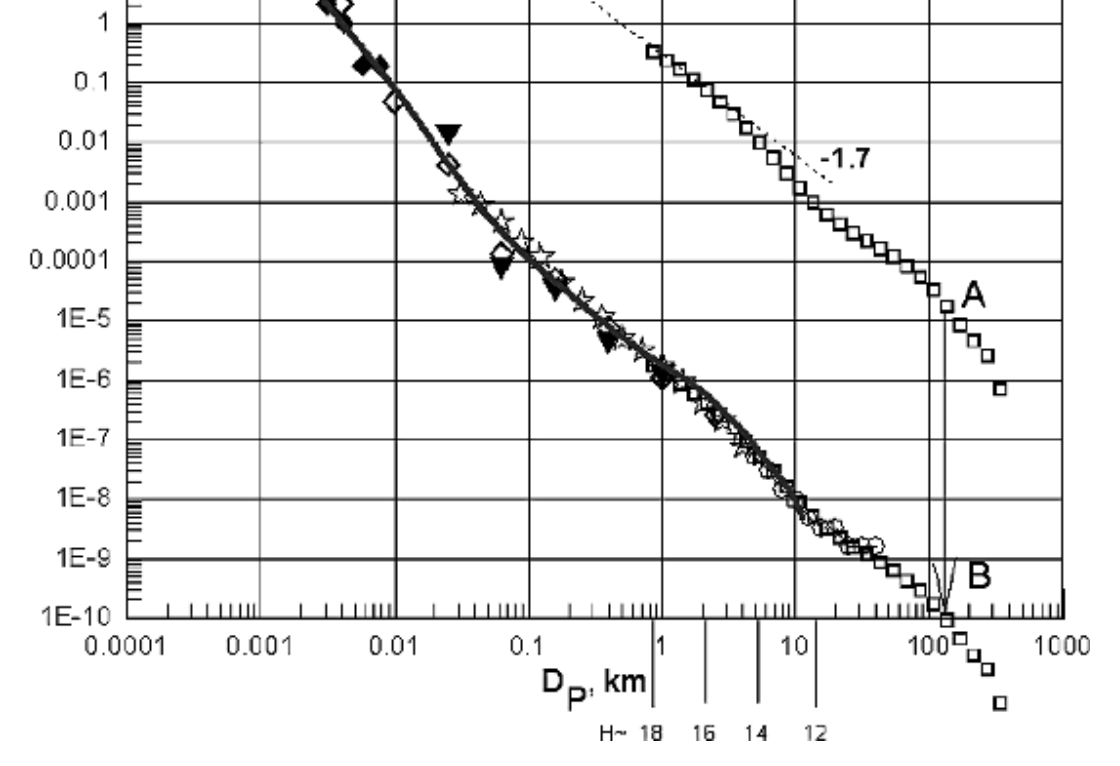
I have an empirically derived frequency curve.
From the curve, I aim to model counts per unit time. The x-axis is diameter, and the y-axis the likelihood of observing the diameter per one year. I have approached this as arising from a Poisson process to model counts. However, the challenge I experience is defining bins (i.e., assigning what diameter sizes to calculate counts for). For instance, if bins are set at 0.5 km intervals (e.g., 1, 1.5, 2,..., 100 km), then the modelled count is larger than if bins are at 1 km intervals (e.g., 1, 2, 3,..., 100 km).
What I am to learn is if anyone has a suggested a protocol for estimating counts despite the binning problem.

