1
$\begingroup$

I am trying to run a linear mixed model (LMM) to observe how CH4 and CO2 fluxes change over time. I have a randomized block design with repeated measures over time. I also have an unequal sample size, as I wasn't able to sample a block during one of my time points. I have tried fitting a LMM to my data but see that the random effect, that is controlling for my repeated measures, is causing a singularity issue. I'm afraid that if I remove this variable and run a simple linear regression, I would have pseudo-replication. Some explanation of my variables:

  • plot_type = treatment
  • plot_id = unique id (block id & treatment id together)

The code and error from the model:

buck.flux.co2 <- lmer(co2_flux ~ plot_type+ (1|plot_ID), data = bucket_data)

boundary (singular) fit: see help('isSingular')

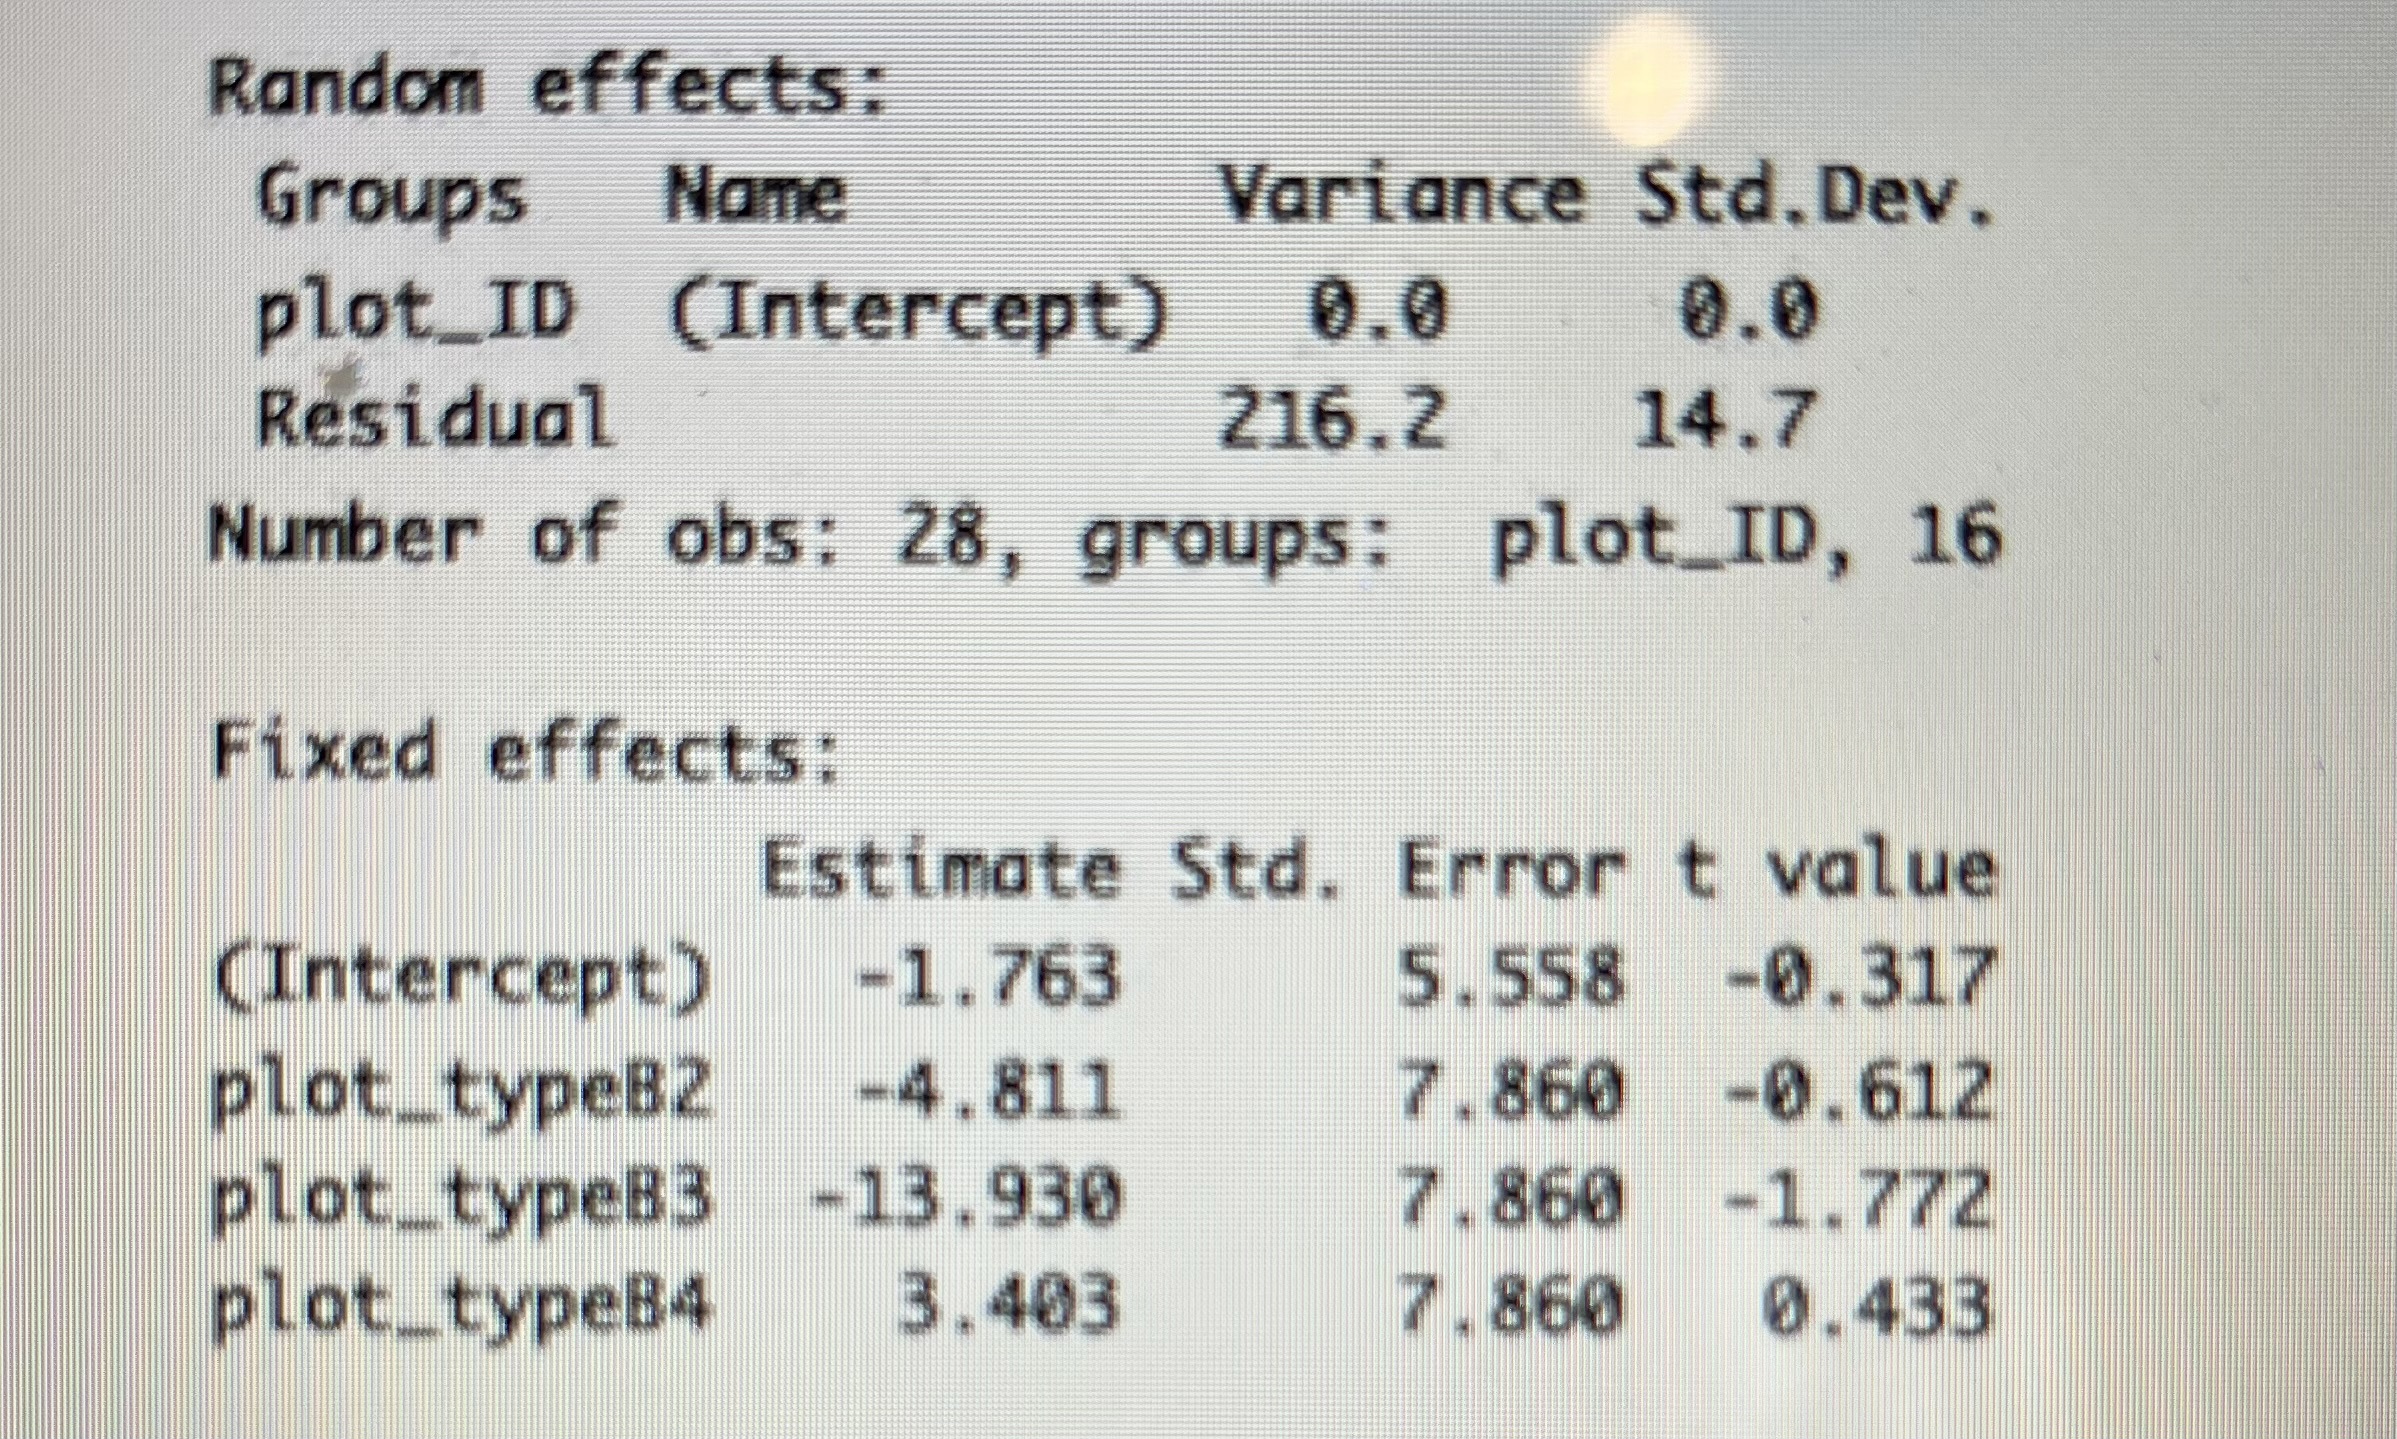
enter image description here

I have heard that having this means that my random effect variable explains none of the variation we see. However, because my ecological system is so variable, I would expect my random effect variable to control for at least a little bit of the variation.

Is there a way for me to check that this is a true response, in that my block design didn't influence any of the variation? If I cant check, will having the singularity error influence my results or can I simply ignore the error? Is there another simpler model in which I can remove this random effect variable but still account for repeated and unequal measurements?

I tried using a glm() but I couldn't find a distribution that would fit a left skewed dataset that had a large amount of negative continuous values. I have visualized the data and there doesn’t seem to be significant differences between treatments but again I would expect there to be some variation.

$\endgroup$

1 Answer 1

0
$\begingroup$

There are a number of things to comment on here. First, regarding this point:

I tried using a glm() but I couldn't find a distribution that would fit a left skewed dataset that had a large amount of negative continuous values.

If you require a different residual term to account for your model in a GLM, then naturally this would extend to a GLMM, which is the mixed model equivalent. I'm not sure I necessarily see the issue with having a lot of negative values unless your data is constrained to only have negative values, where perhaps your predictions from such a model may be limited depending on how the data is distributed. The skew is another issue, particularly given you have a very low sample size, but more on that below. More importantly, why are the values negative? Does CO2 become negative over time? One can probably work around this, but more context may be necessary regarding that point.

Is there a way for me to check that this is a true response, in that my block design didn't influence any of the variation? If I cant check, will having the singularity error influence my results or can I simply ignore the error? Is there another simpler model in which I can remove this random effect variable but still account for repeated and unequal measurements?

First, do not ignore the singularity error, particularly given that it is very common error in mixed modeling that denotes a serious issue with your model. The problem is obvious when you see there is no random intercept variation at all (literally zero) and the by-group fixed effects all have the same standard error (all $SE = 7.860$).

In this case, it seems directly related to the fact that you are "double-dipping" with your group variable for plots (you have essentially coded treatment twice in your model). Because it has little ability to estimate the random effect variance, the matrix simply becomes singular. You also have 16 plot IDs but only 28 observations. This model has an obscenely low number of observations that likely cannot be estimated well in a mixed model anyway (unless there is some other serious mis-specification here that is not noted and is contributing to the observation count).

Without knowing more about your repeated measures, I'm guessing that you had two time points and you were accounting for the repeated measures by using a mixed model. But with just two time points, one can easily just fit this with a GLM and use time as a main effect/interaction with the treatments, where one can just compare how the treatments look at both time points. You can also simply visualize your data to see if there is anything spooky going on with your data that you have overlooked.

$\endgroup$

Your Answer

By clicking “Post Your Answer”, you agree to our terms of service and acknowledge you have read our privacy policy.