I work in the analysis of biological data, and am familiar with the use of maths to determine a test statistic, and the comparison of this test statistic with a threshold to evaluate a hypothesis. Using frequentist frameworks with $p$ values and using Bayesian frameworks with posterior probabilities are both common. These test statistics can be very small, in the order of magnitude of $10^{-6}$, such that talking about the exponent is most convenient. This is particularly the case in situations where multiple testing occurs, and one is discussing nominal rather than corrected test statistics.
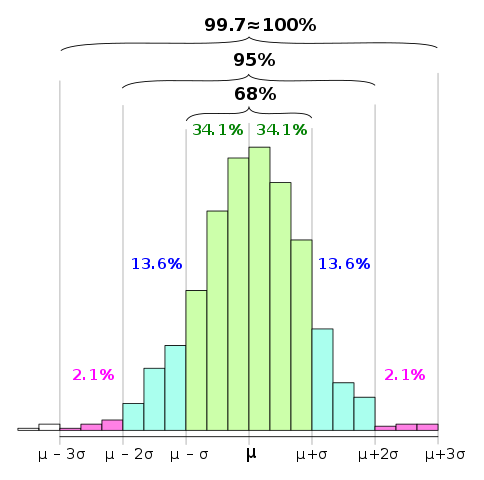
In physics, in the popular-science media at least, the significance threshold is usually talked about in terms of $σ$ with experimental results that reach the five or six $σ$ threshold being generally accepted. My understanding is this is how many observed standard deviations the test statistics is from the value predicted by the null hypothesis.
Under a frequentist framework, assuming a normally distributed test statistic, the $p$ value and $σ$ are directly related. In R this would be p_value = pnorm(-sigma) with five $σ$ corresponding roughly to $3·10^{-7}$ and six to $10^{-9}$.
What is the reason for this difference?
The biggest downside of this method seems to be the problem of skewed distributions, where a test statistic is more likely to be within a certain number of standard deviations on one side of the mean than the other, but I am sure they have thought of that. There could be a similar issue with heavy tailed distributions.
It also makes me wonder how Bayesian maths could be used, and it is worth nothing that the physics papers a quick google brings up do not talk about sigma, and prominently include the intersection with biology.
It is worth noting that the generally accepted thresholds are very different, with 5% being common in many biological fields compared with the 0.00003% of five sigma. This may well be related, but does not seem to answer the question, as one can just talk about the exponent and the numbers are similar. As to why it is so strict is covered in this question.
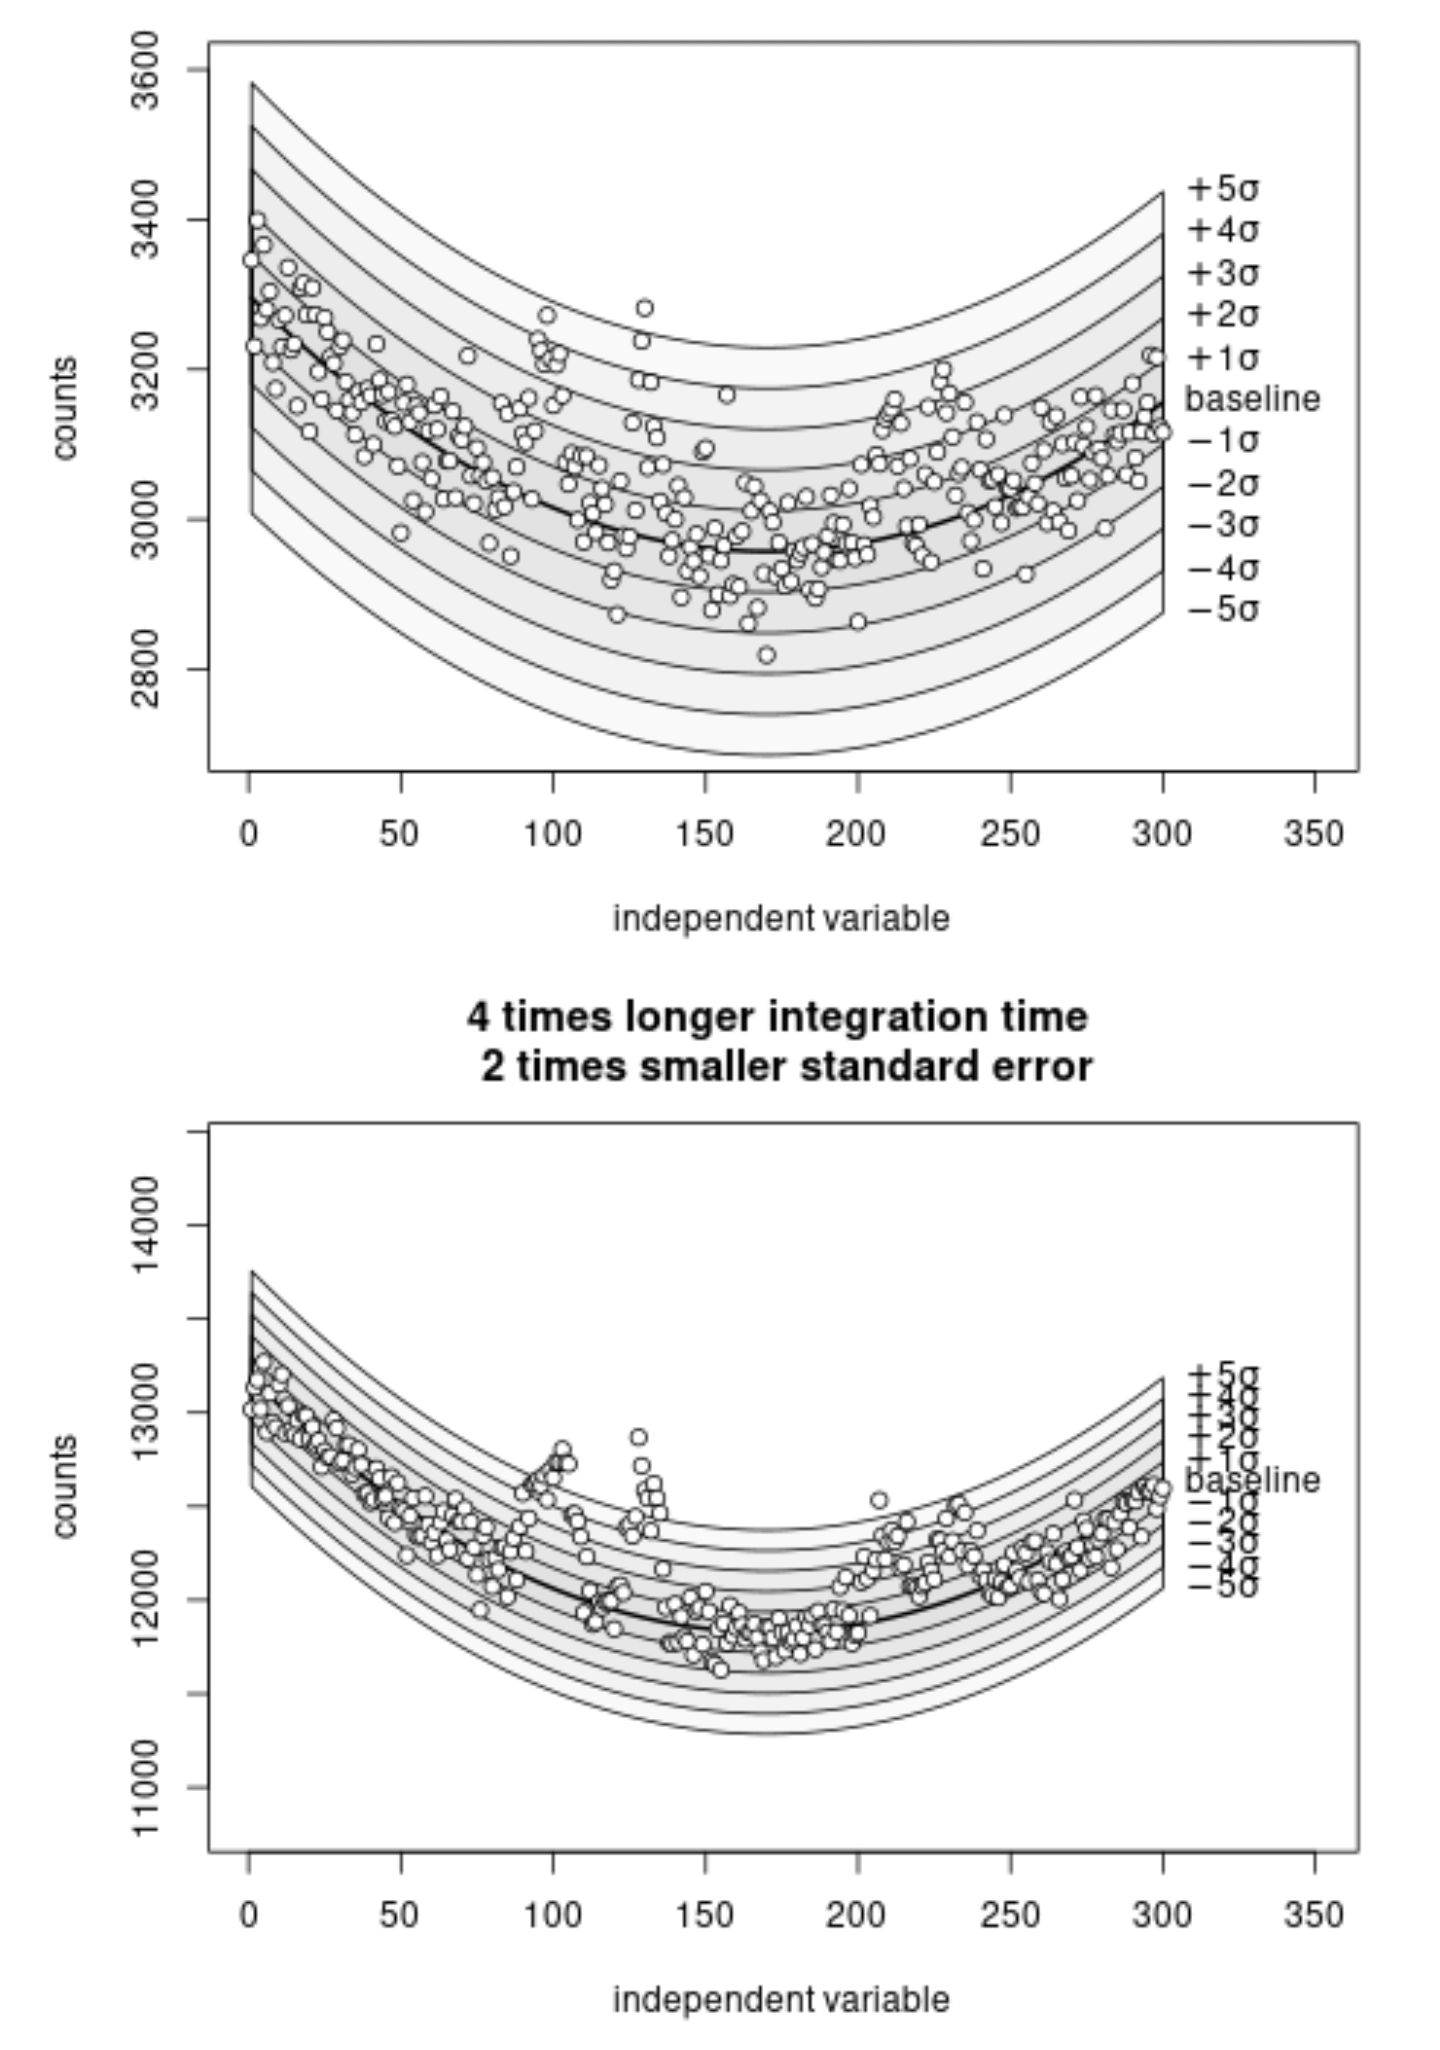
As an illustration of what I mean, take the "Higgs Bump", that showed the existence of the Higgs boson. Obviously the analysis is complex, but taking the simple case of a single bin this is the number of events per GeV with a mean of around 1000. At this number of events this distribution is well modelled by the normal approximation, and observed counts would be expected to by symmetrically distributed around the mean, and sigma would behave very similar to a p value based on say the Poisson distribution.
If these expected values were closer to ten, this would not be true. Using a sigma-based threshold under the null, one would be more likely to get a false rejection due to high counts than low counts (I think).
This seems a negative feature of the analysis method, that a p value or posterior probability based threshold does not have. As the methods are equivalent when the assumptions are met, it would seem the sigma based method has only disadvantages.
![]()


