Because you are concerned about finding small numbers of subjects (one), and you suppose (in a comment) that the subject locations are independent, it is reasonable to model the occurrences of animals as a Poisson process.
If you would like some details, let the study region be $\mathcal R.$ For any measurable subset $\mathcal A\subseteq\mathcal R$ let $N(\mathcal A)$ be the number of animals that can be encountered (at a given time) within $\mathcal A.$ Let $p$ be the density (expected encounters per unit area) so that for all such $\mathcal A,$
$$E[N(\mathcal A)] = \iint_{\mathcal A}p(\mathbb x)\,\mathrm d \mathbb x.\tag{*}$$
Under the Poisson assumption, the chance of encountering at least one animal is
$$\Pr(N(\mathcal A) \ge 1) = 1 - \Pr(N(\mathcal A) = 0) = 1 - \exp\left(-E[N(\mathcal A)]\right).\tag{**}$$
You are contemplating an increasing sequence of regions $\mathcal A_r$ consisting of disks of radius $r$ around a fixed point. Consequently, if there exists at least one animal in $\mathcal R,$ there will be a minimal $r$ for which $(**)$ equals or exceeds your target probability $\alpha = 10/100$ (for instance). Consequently, $r$ is the smallest (nonnegative) radius for which
$$\exp\left(-E[N(\mathcal A_r)]\right) \le \alpha,$$
equivalent to
$$E[N(\mathcal A_r)] \ge -\log(1-\alpha).$$
To illustrate, let's specialize to the case where $p$ is constant (a homogeneous Poisson process) and let "$p$" be that constant, so that
$$E(N(\mathcal A_r)] = p\,\pi r^2$$
is just $p$ times the area of $\mathcal A_r.$ The solution is
$$r_* = \sqrt{\frac{-\log(1-\alpha)}{p\pi}}$$
provided $\mathcal A_{r_*}\subseteq \mathcal R$ -- that is, this disk must lie entirely within the study area. (A solution still exists otherwise, but the areas of $\mathcal A_r$ no longer have such a simple expression.)
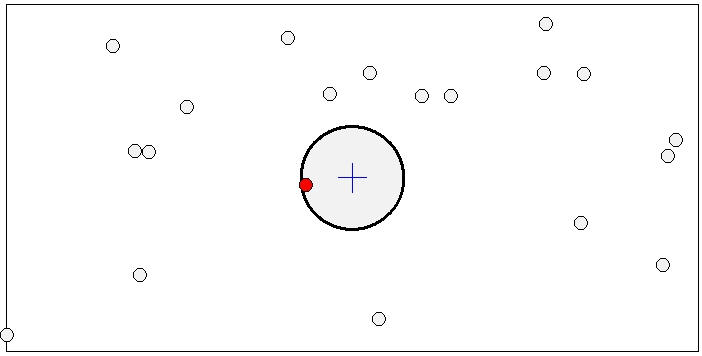
Relative to the center of a rectangle with $20$ animals randomly and uniformly located within it, here is a plot of a possible set of locations within a rectangle $\mathcal R$ and the solution for $\alpha = 50/100$ shown as a shaded disk $\mathcal A_{r_*}$:

The blue cross marks the origin. All animals encountered within radius $r_*$ are shown in red (there is one in this example).
A simulation replicating this study 10,000 times found at least one animal was encountered in 4953 cases, differing from the target frequency (of 5000) by a small amount attributable to random variation. The following R code reproduces the simulation and recreates the figure.
N <- 20                  # Expected total abundance
xlim <- c(-1,1)
ylim <- c(-1/2, 1/2)     # Rectangular region
alpha <- 50/100          # Chance to encounter at least one animal
#
# Compute the critical radius.
#
p <- N / (diff(xlim) * diff(ylim)) # Density per unit area
r.star <- sqrt(-log(1 - alpha) / (p * pi))
#
# Run a simulation to check.
#
unit.circle <- (\(a) cbind(cos(a), sin(a))) (seq(0, 2*pi, length.out = 361))
set.seed(17)
plotted <- FALSE
sim <- replicate(1e4, {
  #
  # Create a random collection of animal locations.
  #
  x <- runif(N, xlim[1], xlim[2])
  y <- runif(N, ylim[1], ylim[2])
  i <- x^2 + y^2 <= r.star^2      # Identify encountered locations
  #
  # Plot the points.
  #
  if (!isTRUE(plotted)) {
    plotted <<- TRUE
    plot(xlim, ylim, type = "n", bty = "n",
         asp = 1, xlab = "", ylab = "", xaxt = "n", yaxt = "n")
    rect(xlim[1], ylim[1], xlim[2], ylim[2])
    circle <- r.star * unit.circle
    polygon(circle, col = gray(0.95), lwd = 2)
    points(x, y, pch = 21, bg = ifelse(i, "Red", gray(0.95)))
    points(0, 0, pch = 3, col = "Blue", cex = 1.5) # Origin
  }
  sum(i) >= 1
})
(mean(sim))

