2
$\begingroup$

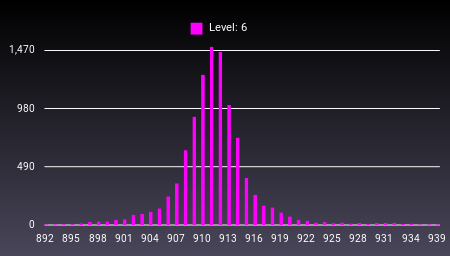
I have a device that takes sensor readings every 15 seconds. When the sample size reaches 10,001 the device deletes the oldest reading. Thus keeping the sample size at 10,000. Analysis of the data so far reveal readings that follow a standard distribution. Example:
For Level: 6 w/Sample size: 10000
Mean: 911 Min: 892 Max: 939 Mode: 911 StdDev: 4.2
Readings w/in 2 StdDev: 9516 Range: (903-920) - 95.2%

Am I biasing or affecting my calculations by managing my sample size in this way. Also, any suggestions about understanding my data would be appreciated.

data I collected so far:

  • 3 Mean: 477 Min: 462 Max: 502 Mode: 477 StdDev: 3.9 Sample size: 3124
  • 4 Mean: 632 Min: 610 Max: 657 Mode: 632 StdDev: 4.2 Sample size: 7446
  • 5 Mean: 796 Min: 777 Max: 820 Mode: 796 StdDev: 4.2 Sample size:10000
  • 6 Mean: 911 Min: 892 Max: 939 Mode: 911 StdDev: 4.2 Sample size:10000
  • 7 Mean:1021 Min:1006 Max:1023 Mode:1021 StdDev: 2.3 Sample size: 2744
$\endgroup$
2
  • 3
    $\begingroup$ If you do your calculations correctly, how could there be a bias? Perhaps your question concerns whether the properties of the last 10,000 data could be used to make inferences about any earlier data? If so, we need to know a lot more about your device. $\endgroup$
    – whuber
    Commented Aug 5 at 22:20
  • 1
    $\begingroup$ This seems like a case for reservoir sampling. $\endgroup$
    – usεr11852
    Commented Aug 6 at 2:14

1 Answer 1

0
$\begingroup$

Short answer; there is no problem at all (no bias, no invalid calculations, etc.)

Long answer: it (of course) depends on what you are trying to do with this data.

10,000 data points, with a frequency of 0.066 Hz, amounts to 41.667 hours, or ~ 1.74 days (assuming your process monitoring is running 24/7). If you are running only 8 hours/day, it covers a full week.

Also, all the measurements will have a time stamp associated.

Let's say that, for argument's sake, you are monitoring a continuous, 24/7 process. If you download the data every day, for analysis, all is fine. Of course, if you download all the 10,000 samples, many will be not just from the previous day, but from 2 days ago. You need to use the time stamp to distinguish them, and only analyze the 5,760 datapoints which cover the last 24 hours.
It is unlikely though that you would analyze a full 24 hours; you would divide it by some "rational subsample" (see any textbook, paper, on statistical process control), and analyze via Control charts (akak Shewhart charts), such as Xbar-R, etc.
If you do not download everyday, you will have missing data... (which may or not matter in your context).
If you run only 8 hours per day, then you need to download every week. Similar remarks as above apply in that case (or other use cases) as well. But if you wait a week to check your process, you might as well not bother at all (too late to detect any anomaly, and intervene).
So if your download intervals are appropriate for your use, and use time stamps to avoid analyzing previously already analyzed data, the instruments should serve you just fine.

$\endgroup$
2
  • $\begingroup$ The device runs continuously 24/7. I am monitoring an environment that can be only in 1 of 7 different states (the example showed level 6 but its really state: 6) here are the stats for state 5: Mean: 796 Min: 777 Max: 820 Mode: 796 StdDev: 4.2 Sample size:10000. By continuously taking readings I create these statistics and over time I want to confidently judge what state I'm in. $\endgroup$ Commented Aug 7 at 3:37
  • $\begingroup$ You need to define a "rational subsample" (Google this term, maybe together with the term "process control"). This depends on how often you think the process will change state, how sudden the state change is, etc.. Once you do so, make sure you download the data often enough so you do not miss a state change. Say, state changes on average every 4 hours, so you would need to download data at most every 8 hours, at and least every 36 hours (because your device does not get to 48 hours). Now the question is, what if the state changed 8 hours ago, and you find that out now? $\endgroup$
    – jginestet
    Commented Aug 7 at 4:24

Your Answer

By clicking “Post Your Answer”, you agree to our terms of service and acknowledge you have read our privacy policy.

Not the answer you're looking for? Browse other questions tagged or ask your own question.